


Uncategorized
New Fed proposal could shift bank Treasury, MBS demand
admin | November 2, 2018
This document is intended for institutional investors and is not subject to all of the independence and disclosure standards applicable to debt research reports prepared for retail investors.
A new Fed proposal to ease liquidity requirements for some large US banks could eventually lead to a reduction in their holdings of Treasuries, MBS and other liquid assets by as much as $150 billion. The Fed proposal at a minimum looks like a headwind to future demand and could be a catalyst for eventual sales of these assets by affected banks rotating into higher yielding securities or loans.
New liquidity rules
The Federal Reserve released a proposal this week (here) that would reshuffle the liquidity deck for large banks. Under existing rules, the most stringent liquidity framework applies to banks that have $250 billion or more in total assets, $10 trillion in custodial assets or have significant international operations. A less stringent framework applies to banks with more than $50 billion but less than $250 billion in total assets. Under the proposed change, banks get divided into five categories with different liquidity requirement (Exhibit 1). Most importantly, the bar for the more stringent framework would be moved from $250 billion to $700 billion, potentially reducing liquidity requirements for banks between $250 billion and $700 billion by as much as 30%.
Exhibit 1: The Fed’s proposed liquidity requirements puts banks in categories
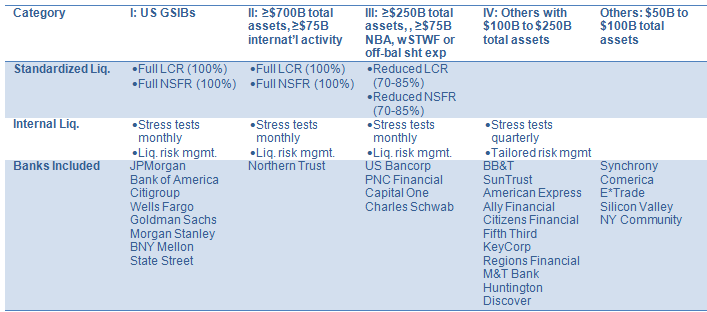
Note: NBA = nonbank assets, wSTWF = weighted short-term wholesale funding. Source: Federal Reserve
The subset of banks potentially affected by this proposed change includes some of the largest US super-regional banks. According to the Fed, the list includes US Bancorp, PNC Financial Services, TD Group, Capital One Financial and Charles Schwab Bank. These banks hold more than half a trillion dollars of High Quality Liquid Assets (HQLA), and a 30% reduction in their required liquid reserves could reduce that amount by approximately $150 billion (Exhibit 2).
Exhibit 2: Banks affected by proposed changes may hold up to $525 billion in HQLA
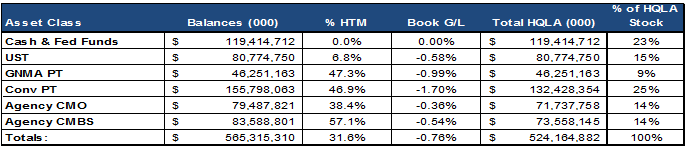
Source: SNL Financial, as of 6/30/2018
Hold ‘em or fold ‘em?
While the proposal is open for public comment until January 22, the most glaring implication for market participants would be if affected banks actively reduced their stores of HQLA by selling Treasuries, pass-throughs, CMOs or agency CMBS. Some reduction of these holdings will occur passively as securities mature, amortize or prepay. The banks collectively hold just under $120 billion in cash and fed funds. As the Fed continues to reduce the size of the SOMA portfolio, the amount of excess reserves in the system should be reduced as the Fed puts bonds into the system and takes cash out. Cash and reserve balances make up nearly a quarter of affected banks’ HQLA stores, and if the banks needed to replace those reserves, they would have to do so with another Level I HQLA asset such as Treasuries or Ginnie Mae MBS or CMOs. A material reduction in the amount of liquid assets these banks hold would, at a minimum, take pressure off these banks to replace reserves with other assets or, alternatively, increase deposit rates in an attempt to keep deposits and reserve balances from running.
Based on asset concentration, it appears that conventional pass-throughs could be the most meaningful source of supply as they make up a quarter of the banks’ liquidity stock. Treasuries, agency CMOs and CMBS make up roughly 15% each and Ginnie Mae pass-throughs make up less than 10%.
There may be practical deterrents to active sales of HQLA, however. Comparing the fair value of these asset classes to amortized cost, all on average had embedded losses as of June. Interest rates have only gone higher since then, suggesting likely further losses against book value. The asset class with the biggest concentration, conventional pass-throughs, is also the one with the biggest percentage loss, suggesting it would be difficult to actively reduce HQLA without realizing losses. Of course, banks likely hold individual positions that they could sell flat or at a gain, but those are likely assets with some of the highest book yields, making it less plausible to sell those assets and redeploy proceeds into likely more capital intensive securities or loans with comparable yields.
One additional headwind to sales is the amount of securities locked up in Held-to-Maturity (HTM) portfolios. Nearly 60% of the banks’ agency CMBS holdings, for instance, are in HTM. Breaking HTM to sell a portion of a bank’s HQLA would require that bank to mark all like assets to market – a huge deterrent to active sales. In all likelihood, a reduction in these banks liquidity needs would result in a slow and steady passive runoff to their new, lower liquidity requirements, using the cash flow to fund loan growth or buy higher yielding securities.
Material changes to bank strategies are not likely to start in 2018. The proposal remains open for public comment until January 2019 and would likely not go into effect until 2020. The reduction in HQLA would get triggered by the proposal to move the banks from an ‘advanced approach’ to a ‘modified’ one. Under the advanced approach, banks have to calculate their liquidity needs based on the single largest outflow in a 30-day liquidity stress scenario. The peak net outflow rule attempts to offset timing differences between inflows and outflows to ensure that a bank maintains enough HQLA to cover their largest outflow day over the period. Under the modified LCR rules, banks only need to hold ample liquidity to cover a 21-day stress period, a potential 30% or $150 billion reduction in these banks’ stocks of HQLA. While we do not anticipate active selling of assets for reasons mentioned above, if passed, this would likely be a significant and permanent reduction in demand for liquid assets from these banks going forward.
Implications for debt and funding markets
Banks getting relief from the most stringent liquidity rules but limited by HTM or losses from selling HQLA may instead turn to the liability side of their balance sheet. Some banks have replaced deposits that might run off in a 30-day liquidity stress scenario with longer-maturity wholesale debt or commercial paper. The more stable wholesale funding reduces scenario runoff and the need for HQLA. If HTM or embedded losses limit ability to reduce HQLA, the banks instead may pull back on some debt or commercial paper issuance.
Some banks also reduced repo lending after funding for the repo book drove up short-term liabilities and triggered higher HQLA. Again, if HTM or embedded losses leave the bank with excess HQLA, banks could expand repo lending to effectively raise liquidity requirements to the level of liquid assets.
Capital changes, too
The liquidity rules also come with at least one important change to capital, too: a new ability for banks with $250 billion to $700 billion in assets to opt-out of rules that penalize the bank for taking interest rate risk in available-for-sale securities. Current rules require any mark-to-market losses in AFS to flow directly into regulatory capital, penalizing the bank if interest rates rise, spreads widen or anything else happens to reduce the fair value of securities below book value. To avoid this risk, many banks have moved securities into held-to-maturity accounts, where, with rare exception, securities get held at book value. However, accounting rules also rarely allow banks to sell securities out of HTM. Opting out of the current rules should allow banks over time to increase the share of securities held in AFS, improving their ability to occasionally sell securities and adding liquidity to their balance sheet. Banks may still avoid interest rate risk in AFS since it still affects the tangible value of the firm, but at least they’ll have a friendlier regulatory treatment.
* * *
The view in rates
The strategy of buying the 10-year note as yields rise beyond 3.15% and selling as yields drop below 2.85% still seems like a good approach. With strong October payrolls driving yields toward 3.20%, duration looks mildly attractive. Yields on the front end of the curve look bound to keep rising as the Fed chases its dots. The last set of FOMC minutes made clear the Fed’s intent to hike through most of 2019. The minutes included a clear discussion of potentially hiking through neutral into restrictive territory. Look for the curve to keep flattening from here.
The view in spreads
Nearly all spread markets continue to widen, with agency MBS and high yield and corporate debt at or near their widest levels for the year. Rising credit risk and the prospect of some slowing in economic growth continue to mix with the Fed’s steady withdrawal of liquidity. A drift wider in corporate spreads should pull agency MBS and other products along with it, although agency MBS would still likely benefit from investor interest in liquidity.
The view in credit
While the fundamentals of corporate balance sheets have some weak spots, they are harder to find on consumer balance sheets. Median household income is at a record along with household net worth, and household debt costs as a percent of disposable income are near a record low. If there is weakness, it’s in households with sizable student debt, and rising delinquencies in that asset signal that the debt is weighing heavily.