


Uncategorized
Measuring relative value through spread-per-turn-of-leverage
admin | January 11, 2019
This document is intended for institutional investors and is not subject to all of the independence and disclosure standards applicable to debt research reports prepared for retail investors.
The nearly 5-point drop in average leveraged loan prices from September to January and the recent rebound has reminded CLO investors that the risk to debt and equity can change quickly. Tracking changes in risk and fair value across CLO classes can be difficult, but the notions of leverage and spread-per-turn-of-leverage turn out to be extremely useful with stable patterns across classes and over time.
Moving from MVOC to leverage
Even though CLO debt does not rely on the market value of underlying loans for repayment, debt pricing should reflect the changing market value of deal assets. Falling loan prices arguably reflect a rising implied probability of loan default and loss, which would affect repayment. However, not all CLO classes have equal exposure.
CLO investors currently use the market value of overcollateralization or MVOC to gauge class exposure to asset value, but leverage reflects the same information in an arguably more useful way. MVOC reflects the market value of deal assets as a percent of the par value of a class and all senior classes. Leverage reflects the market value of deal assets as a multiple of remaining equity if the deal only issued a given class and all senior classes. An example helps illustrate the difference.
Credit Suisse Asset Management priced Madison Park XXIX in late September, raising $744 million in debt and $56 million in market value equity to buy an estimated $800 million in market value leveraged loans (Exhibit 1). After issuing ‘AAA’ through ‘B’ debt, the deal shows an MVOC for the ‘B’ class of 107.5 and leverage of 14.29. At this point, the measures are interchangeable for practical purposes. Both reflect the ability of asset liquidation value to cover the par value of CLO debt.
Exhibit 1: Comparing MVOC and leverage across class of Madison Park XXIX
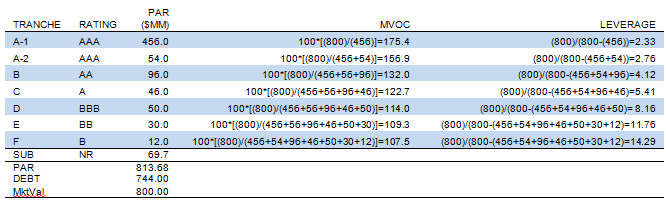
Note: Market value as 9/28/18 assumes the manager purchased all loans in the deal at par. Source: S&P, APS
The difference between MVOC and leverage becomes much clearer after plotting one against the other (Exhibit 2). At high levels of MVOC, small or even large changes have very little impact on leverage. That makes sense since adding a few dollars of debt below ‘AAA’, for instance, only reduces net equity by a small amount. However, at low levels of MVOC, small differences have an exponential effect on leverage. As the market value of assets approaches the par value of issued debt, net equity rapidly disappears and leverage rises to infinity. In other words, the lowest classes of CLOs are highly leveraged to small changes in the value of CLO assets.
Exhibit 2: Leverage explodes as MVOC approaches 100
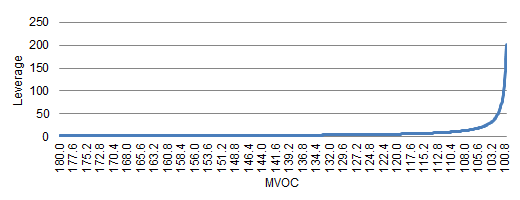
Source: APS
Consistent spread-per-turn-of-leverage across CLO classes
Leverage arguably becomes much more useful under the assumption that investors demand more spread for every turn of leverage. That looks like the case in Madison Park XXIX since the spread per turn of leverage in each class at issuance falls within a relatively narrow range (Exhibit 3). Discount margin ranges from 114 bp to 790 bp, but discount margin or spread per turn of leverage only ranges from 37 bp to 55 bp.
Exhibit 3: Wide range in spreads, narrow range in SPTL* in Madison Park XXIX
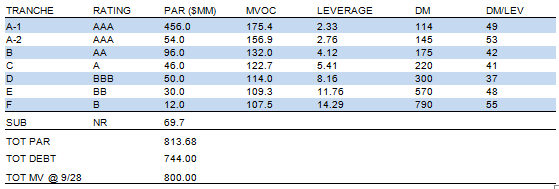
Note: *SPTL = spread-per-turn-of-leverage. Market value at 9/28/18 assumes the manager purchased all loans in the deal at par. Source: S&P, APS.
Consistent spread-per-turn-of-leverage over time
The assumption that CLO investors demand more spread for every turn of leverage also looks plausible over time (Exhibit 4). The CLO market has seen three episodes of material declines in the average value of leveraged loans: one in 2011, one from 2015 into 2016 and one recently. In each episode, the ‘BB’ and, to a lesser extent, the ‘BBB’ classes failed to nominally widen enough to compensate for the rapidly rising leverage in these classes. In 2011, the ratio actually went negative as loan prices fell far enough to more than wipe out the equity class in the median deal. In the 2015 through 2016 episode, spread per turn of leverage on the median ‘BB’ class dropped to 10 bp and in the latest episode toward 20 bp. Investment grade classes, however, have widened smoothly in line with rising median class leverage to offer a relatively narrow range of compensation. From mid-2013 to mid-2015, that range was 40 bp to 60 bp. Since early 2017, the range has run from 30 bp to 45 bp.
Exhibit 4: Falling loan prices drive up CLO leverage, but spreads accommodate
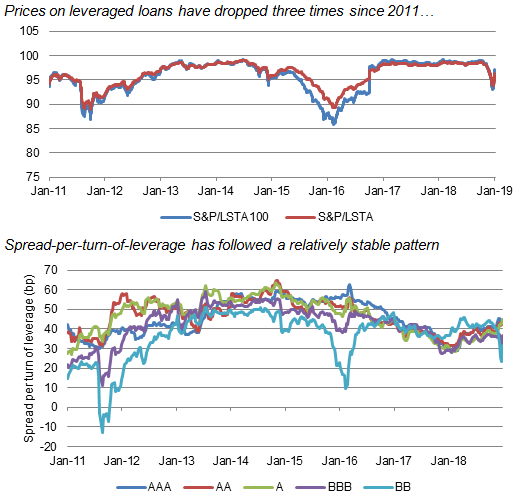
Note: Spread-per-turn-of-leverage reflects the spread, MVOC and leverage of the median outstanding CLO. Source: Bloomberg, APS
Both the spread per turn of leverage offered across CLO classes at issuance and in the primary and secondary markets over time strongly suggest that the market at least implicitly prices CLO risk in line. The measure should differ from manager to manager and across non-call and reinvestment windows. However, it’s potential to measure nominally very different CLO assets makes it a valuable measure of relative value to watch across time and across offerings.