Uncategorized
Debt reduction at AT&T could drive out-performance
admin | February 1, 2019
This document is intended for institutional investors and is not subject to all of the independence and disclosure standards applicable to debt research reports prepared for retail investors.
AT&T management continues to focus on debt reduction, with a plan to utilize a combination of free cash flow and asset sales to reduce debt by $20 billion in 2019. Successful execution of asset sales in particular could be the catalyst for AT&T debt outperforming peers, including Verizon. AT&T may forgo a tender offer, but could execute an exchange for existing TWX bonds to reduce any structural subordination.
AT&T reiterates focus on debt reduction
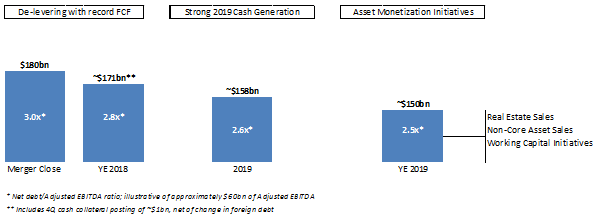
AT&T’s (T) quarterly results were shrugged off by the bond market as the focus was on management’s progress so far on debt reduction since the close or the Time Warner Entertainment (TWX) acquisition. Management reiterated their top priority for 2018 and 2019 is debt reduction and reported that net debt has been reduced by $9 billion since the close of TWX. Record free cash flow of $22.4 billion for the year and $7.9 billion in the quarter is fueling T’s debt reduction efforts.
As management looks to 2019, they are forecasting $12 billion of free cash flow after dividends will be used to repay debt. Based on estimates of $60 billion of adjusted EBITDA, management believes it can reduce net debt to the $158 billion area, bringing leverage down to roughly 2.6x. Additionally, company management is looking at ways to monetize some real estate asset as well as non-core assets to bring in more proceeds for debt reduction. T believes it can generate $6 to $8 billion of proceeds from asset sales and working capital initiatives to be used for debt reduction. The additional proceeds would bring net leverage to management’s 2.5x target by year-end 2019.
Exhibit 1: AT&T’s debt reduction plan
Source: AT&T company reports
Relative Value
As AT&T looks to reduce debt in a meaningful way, the bonds could outperform peers, particularly Verizon, in 2019. The largest catalyst for the out-performance will be management’s ability to execute asset sales. These asset sales are imperative in getting management to that approximate $20 billion of debt reduction in 2019, while demonstrating management’s commitment to the leverage target.
The company has roughly $6.8 billion of debt maturing this year, including TWX’s $650 million maturity in June, and nearly $13.2 billion of term loans outstanding. That said, a tender offer may not even be necessary in hitting its debt reduction target for the year. Furthermore, there is still a strong likelihood that T will execute an exchange offer for existing TWX bonds in an effort to reduce any structural subordination.
This material is intended only for institutional investors and does not carry all of the independence and disclosure standards of retail debt research reports. In the preparation of this material, the author may have consulted or otherwise discussed the matters referenced herein with one or more of SCM’s trading desks, any of which may have accumulated or otherwise taken a position, long or short, in any of the financial instruments discussed in or related to this material. Further, SCM may act as a market maker or principal dealer and may have proprietary interests that differ or conflict with the recipient hereof, in connection with any financial instrument discussed in or related to this material.
This message, including any attachments or links contained herein, is subject to important disclaimers, conditions, and disclosures regarding Electronic Communications, which you can find at https://portfolio-strategy.apsec.com/sancap-disclaimers-and-disclosures.
Important Disclaimers
Copyright © 2024 Santander US Capital Markets LLC and its affiliates (“SCM”). All rights reserved. SCM is a member of FINRA and SIPC. This material is intended for limited distribution to institutions only and is not publicly available. Any unauthorized use or disclosure is prohibited.
In making this material available, SCM (i) is not providing any advice to the recipient, including, without limitation, any advice as to investment, legal, accounting, tax and financial matters, (ii) is not acting as an advisor or fiduciary in respect of the recipient, (iii) is not making any predictions or projections and (iv) intends that any recipient to which SCM has provided this material is an “institutional investor” (as defined under applicable law and regulation, including FINRA Rule 4512 and that this material will not be disseminated, in whole or part, to any third party by the recipient.
The author of this material is an economist, desk strategist or trader. In the preparation of this material, the author may have consulted or otherwise discussed the matters referenced herein with one or more of SCM’s trading desks, any of which may have accumulated or otherwise taken a position, long or short, in any of the financial instruments discussed in or related to this material. Further, SCM or any of its affiliates may act as a market maker or principal dealer and may have proprietary interests that differ or conflict with the recipient hereof, in connection with any financial instrument discussed in or related to this material.
This material (i) has been prepared for information purposes only and does not constitute a solicitation or an offer to buy or sell any securities, related investments or other financial instruments, (ii) is neither research, a “research report” as commonly understood under the securities laws and regulations promulgated thereunder nor the product of a research department, (iii) or parts thereof may have been obtained from various sources, the reliability of which has not been verified and cannot be guaranteed by SCM, (iv) should not be reproduced or disclosed to any other person, without SCM’s prior consent and (v) is not intended for distribution in any jurisdiction in which its distribution would be prohibited.
In connection with this material, SCM (i) makes no representation or warranties as to the appropriateness or reliance for use in any transaction or as to the permissibility or legality of any financial instrument in any jurisdiction, (ii) believes the information in this material to be reliable, has not independently verified such information and makes no representation, express or implied, with regard to the accuracy or completeness of such information, (iii) accepts no responsibility or liability as to any reliance placed, or investment decision made, on the basis of such information by the recipient and (iv) does not undertake, and disclaims any duty to undertake, to update or to revise the information contained in this material.
Unless otherwise stated, the views, opinions, forecasts, valuations, or estimates contained in this material are those solely of the author, as of the date of publication of this material, and are subject to change without notice. The recipient of this material should make an independent evaluation of this information and make such other investigations as the recipient considers necessary (including obtaining independent financial advice), before transacting in any financial market or instrument discussed in or related to this material.


