


Uncategorized
Interest shortfalls hit prime 2.0
admin | October 23, 2019
This document is intended for institutional investors and is not subject to all of the independence and disclosure standards applicable to debt research reports prepared for retail investors.
Elevated prepayments, along with a handful of other factors, have caused certain prime jumbo MBS deals to come up short on the interest required to pay all deal classes. These shortfalls have been borne by investors across the capital structure and may continue if prepayment speeds remain elevated. The recent spate of shortfalls have driven prices on impacted bonds lower and caused certain issuers to change the mechanism for interest shortfall compensation in newly issued deals.
What’s driving the shortfalls?
The shortfalls reflect the lack of requisite funds to cover interest due when loans prepay over the course of a month. For example, if a loan prepays on the third day of the month where it is still an asset of the trust, the borrower owes just two days of interest while the trust is owed 30 days of interest on the loan. The servicer will compensate the trust to some extent, using some or all of the income they receive for servicing the loans.
While the shortfalls may have come as a surprise to some market participants, it is by no means a new risk. The risk, and how investors get compensated, has been addressed since well before the crisis. However, certain post-crisis developments have elevated the risk. Under Basel III, mortgage servicing rights (MSRs) became a much more capital intensive asset for banks to hold. Risk-based capital that banks have to hold on all MSRs has increased 2.5 times and the size of the institution’s MSRs relative to their core capital could generate even greater capital charges if they breached a certain threshold. In response to the more onerous capital treatment, banks changed how they were compensated for servicing loans. Often eschewing the traditional 25 bp servicing strip as compensation in exchange for variable fee based structures where they may be paid as little as $20 a month to service a performing loan.
The overwhelming majority of prime 2.0 deals have minimum servicing of 25 bp or more but some do not. Unsurprisingly, deals with less than 25 bp of servicing are localized to JP Morgan and Flagstar, both bank issuers. In some cases, these deals have as little as 4 bp of servicing compensation and are localized to later vintages. Wells Fargo, the other major bank issuer under their WFMBS shelf still maintains a 25 bp strip. Other non-bank issuers including CIM, PFMT, SEMT and TBMLT all have a 25 bp or greater strip across all their respective trusts. (Exhibit 1)
Exhibit 1: Certain bank-issued PLS have small servicing strips to cover shortfalls
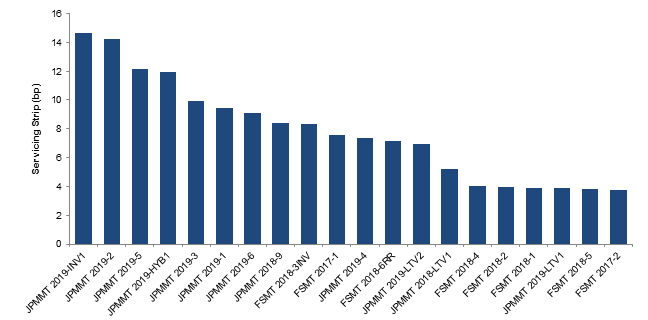
Source: Loan Performance, Intex, Amherst Pierpont Securities
In addition to the reduction in servicing compensation, other factors influence the potential exposure to elevated prepayments and interest shortfalls. A deal’s definition of the prepayment period has an impact. In some cases, the prepayment month is the month before the remittance. In other cases, the prepayment period straddles two remittance periods, covering the first 15 days of the former and fourteen days of the latter. In the case where the prepayment period straddles the remittances, the servicer’s exposure in a given month may be materially reduced.
Given this structural difference, the exact same events can generate a very different obligation to the servicer. Assume for example, Loan A prepays on October 3, generating a 28-day potential shortfall to the trust while Loan B prepays on October 16, generating a 15-day day shortfall. In the prior month structure, the potential shortfall to the November remittance is $4,479 or 43 days of accrued assuming a $750,000 balance and 5% note rate. In the straddle structure, the potential shortfall in November is just $1,354, as the 28 days of lost interest totaling $2,917 plus two days of paid interest on Loan A would be due to the October payment date generating a $208 ‘credit’ for the two days of interest the borrower paid in the November remittance. (Exhibit 2)
Exhibit 2: Prepayment period matters when calculating shortfalls
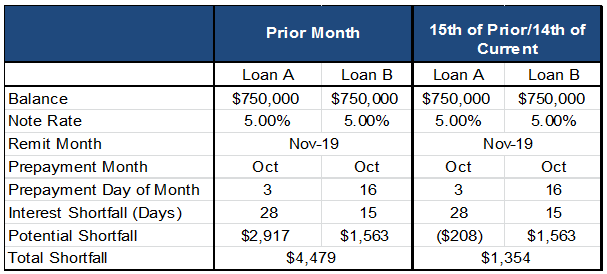
Source: Amherst Pierpont Securities
One final factor is the percentage of servicing compensation available to cover shortfalls. This will vary across shelves, with either 50% or 100% of the total servicer’s compensation available to cover shortfalls. The combination of prepayment period structure, a low cap and a variable servicing structure affords investors with very little protection against potential interest shortfalls. Under a traditional 25 bp servicing compensation structure where 100% of it is available to cover potential interest shortfalls, the trust would have just over $150 per month to cover shortfalls, assuming a $750,000 loan balance. In a variable compensation structure capped at 50%, the trust would have as little as $10 to cover interest shortfalls irrespective of loan size. To compound this, in deals with multiple servicers, there may be different arrangements within the deal where some servicers are obligated to advance 50% of compensation while others are required to advance 100%. This leads to potential servicer concentration issues as loans prepay from the pool, potentially exposing investors to greater concentrations of servicers with lower compensation structures or lower caps on compensating interest.
Market Implications
While the shortfalls in and of themselves have driven affected bond prices lower, second order concerns could have further impact on affected trusts. Since the interest shortfall is borne of a prepayment event and not a credit event, these shortfalls are by and large distributed pro-rata across the capital structure. Given this, some investors and other market participants have raised concerns about potential downgrades on senior bonds. At this time, there does not appear to be any imminent downgrade risk since these are prepayment and not credit events. It appears that operative documents in certain impacted trusts have addressed the issue to some extent. Per the JPMMT 2019-3 prospectus,
“A security rating does not represent any assessment of the yield to maturity that investors may experience in the event of rapid prepayments and/or other liquidations of the Mortgage Loans. In general, the ratings on the Offered Certificates address credit risk and not prepayment risk.”
That being said, issuers appear to be addressing these shortfalls to some extent. In their recently issued JPMMT 2019-LTV3 transaction, JP Morgan; increased the base servicing fee from $20 to $40 per loan, increased the compensating interest cap from 50% to 100% and localized prepayment interest shortfalls to subordinate and IO bonds. The last development will clearly impair IO execution, potentially making deal arbitrage less attractive. For existing trusts, this may be a case of closing the barn door after the horse is out as there is no mechanism in the operative documents to pay back these incurred shortfalls.