


Uncategorized
Combing the sell-off for relative value
admin | February 28, 2020
This document is intended for institutional investors and is not subject to all of the independence and disclosure standards applicable to debt research reports prepared for retail investors.
The rapid equity market sell-off related to global coronavirus concerns took a significant toll on the Investment Grade Corporate Bond Index (Bloomberg Barclays Corp Agg), as OAS widened 20 bp to +116 from +96 from 2/19 to 2/27, the widest level since October of last year. That translated to a -1.89% excess return over a single week, compared to the +0.45% of total return generated as a function of the 2.3% rally in duration-matched US Treasuries. Despite the fear-induced negative performance the near-to-intermediate term outlook for corporate credit remains largely constructive. The back-up in valuation provides an opportunity for investors to add exposure to sectors and individual credits that have been among the hardest hit, including those that may have been overbought in the weeks preceding the sell-off.
Not surprisingly, the hardest hit sectors within the Index included Energy & Basic Materials, as well as Insurance credits, which are most directly impacted by ~15% sell-off in equities over the same period. Also rounding out bottom performers were sectors with the longest duration concentrations, such as Transports and Communications. The Finance sector has demonstrated the most resistance to selling pressures, particularly as lower rates are perceived positively for segments, such as REITs, and increased market volatility should serve as a boost to Brokers/Exchanges (Exhibit 1).
Exhibit 1: Performance by sector (2/19 – 2/27)
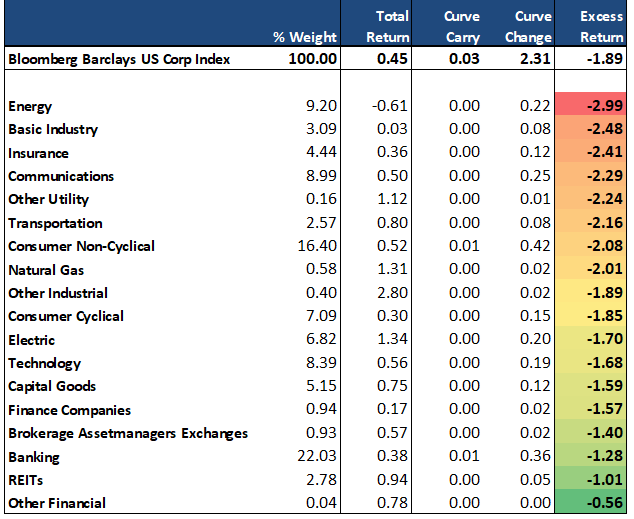
Source: Bloomberg Barclays US Corp Index
Energy – Midstream: Global crude prices have sold off nearly 14% since February 19th, and Energy credits continue to be among the hardest hit in the sell-off. North American pipelines appear unfairly flushed out in this sell-off, with issuers such as ETP, EPD, ENBL and TRPCN among the hardest hit in the entire Index. While high beta Energy is an easy area for investors to target in periods of global stress, domestic pipeline operators remain comparatively insulated to both foreign events and price fluctuations than Integrated, E&P or Oilfield Services operators. The sell-off appears overdone in these Pipelines names, and investors with higher risk tolerance and the ability to withstand near-term volatility should take the opportunity to increase exposure to this particular subgroup.
Exhibit 2: Top/bottom 15 performance by industry (2/19 – 2/27)
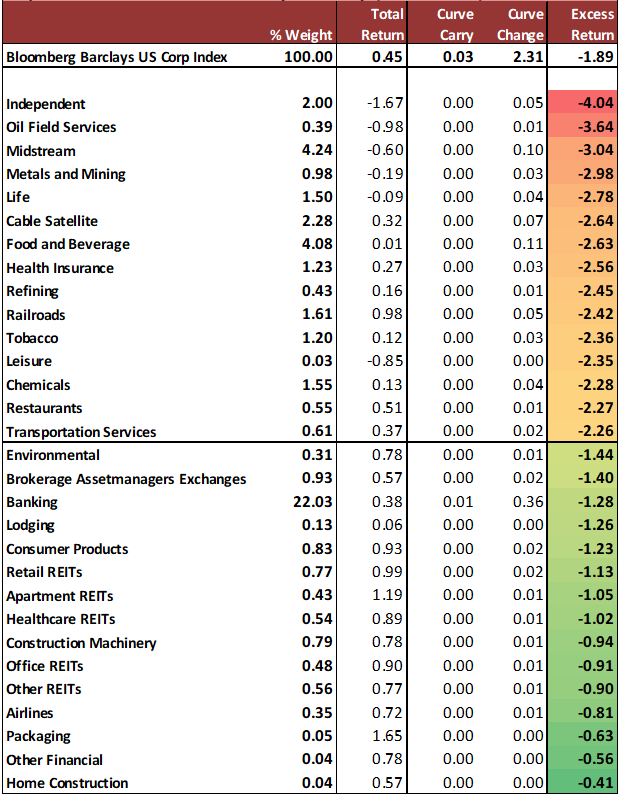
Source: Bloomberg Barclays US Corp Index
The sell-off has mainly been a relatively indiscriminate risk-off move within the market, with investors pushing out spreads on the lowest rated credit within the IG Index (Exhibit 3). The anomaly is within AAA credit – a limited sector in 2020, which has a high percentage of 30 year paper, as well as concentration in university credits, which sold-off alongside hospitals due to affiliation with campus medical centers.
Exhibit 3: Performance by rating (2/19-2/27)
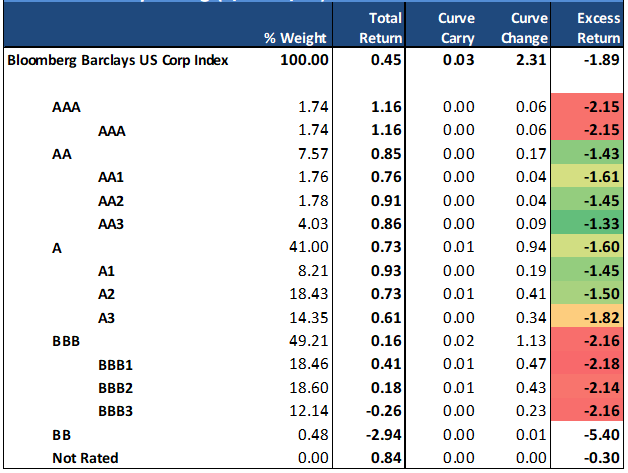
Source: Bloomberg Barclays US Corp Index
Exhibit 4: Long-dated corporate spreads moved the most as a direct offset to the rally in 10 and 30-yr US Treasury yields.
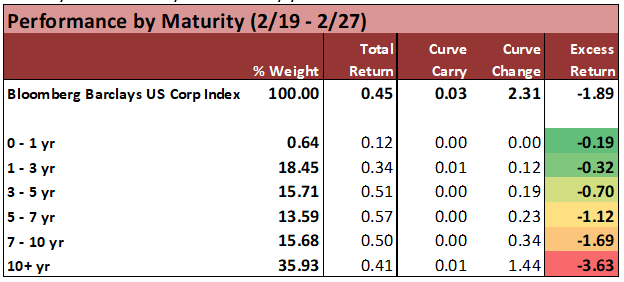
Source: Bloomberg Barclays US Corp Index
Kraft Heinz Company (KHC – Baa3/BB+(n)/BB+): KHC’s negative 4.99% excess return performance follows 4Q results that missed sales estimates and two subsequent downgrades to junk. With two out of three ratings now in HY territory, KHC will be moved out of the IG index at month end. KHC’s large debt balance (over $29.9 billion at year end) could have a hard time finding its footing in the HY market, which could put further pressure on spreads despite the move wider already. KHC has indicated that its turnaround will take time and will only announce its strategic plans in May 2020, despite previous guidance of early 2020. Additionally, KHC’s leverage remains high at 4.4x and is likely to remain above the 4.0x level through fiscal 2021, unless the company is able to execute asset sales (underscoring S&P’s negative outlook). While KHC had previously been looking to sell certain brands including Ore-Ida, Breakstone and Maxwell House, those sales never came to fruition. KHC’s accounting issues last year, while immaterial, may lead potential buyers to drag out due diligence. Furthermore, the SEC investigation into the accounting and procurement issues has yet to be resolved.
Corning Inc. (GLW – Baa1/BBB+(n)): GLW’s performance (down 6.64%) appears to be providing an attractive entry point into the credit. GLW’s debt maturity profile is very back end loaded with a weighted average maturity of approximately 25.6 years. S&P recently put its rating on negative outlook as leverage is expected to peak at 2.5x in 2020 (currently at 2.2x), reflecting near-term challenges in its display and optical units coupled with capital investments and increased shareholder returns. However, the agency went on to note that GLW’s solid competitive position and longer-term business growth opportunities offset near term business volatility. Additionally, GLW’s has had a long track record of driving organic growth. Given the capital investment associated with its product lines, barriers to entry remain high, underscoring its strong competitive position.
Darden Restaurants Inc. (DRI – Baa2/BBB/BBB): With no exposure to China, ratings solidly in the mid-BBB tier and continued outperformance of the casual dining index, the widening in DRI’s 2048 bonds provides for an attractive entry point. DRI’s 2027-2048 curve is now worth +110 bp and DRI 2048 bonds are trading 80 bp wide to MCD 2047 bonds (a company with exposure to China). While DRI’s smaller capital structure and lower liquidity provides for some of the spread differential to MCD, investors are not valuing the company’s strong credit profile, conservative financial policy and solid operating performance. DRI currently manages lease adjusted leverage to the 2.0x-2.5x range. As of the last fiscal quarter, estimated leverage was 2.25x, which compares very favorably to leverage of 3.8x at MCD. MCD’s increase in leverage has largely been driven by shareholder remuneration. Despite recent weakness in the casual dining industry, DRI still posted same restaurant sales growth (SRS) at its two largest banners. Management proved successful in managing costs and posted good margin growth in the face of both commodity increases and labor inflation.
Exhibit 5. Bottom 40 excess returns by issuer (2/19 – 2/27)
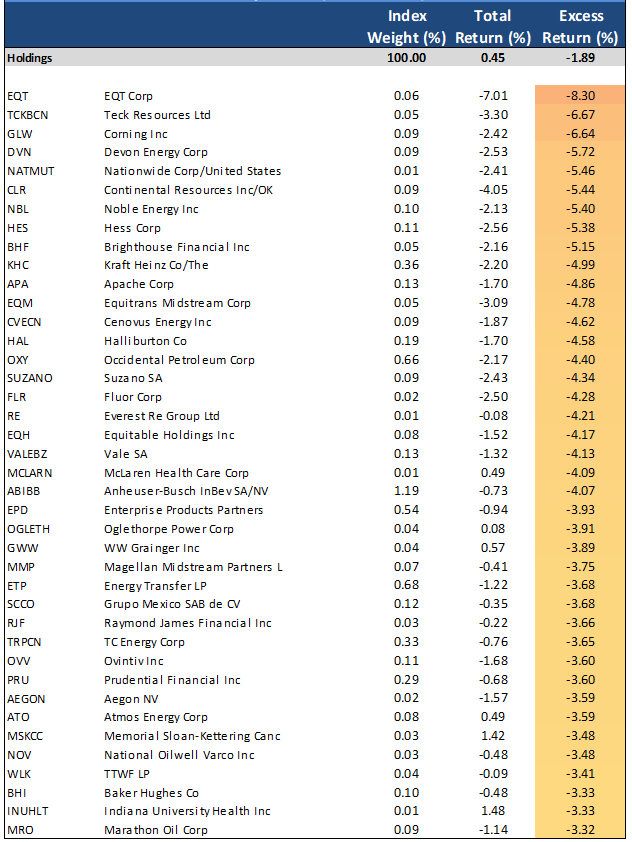
Source: Bloomberg Barclays US Corp Index
Lear Corporation (LEA – Baa2/BBB-): LEA’s underperformance of its 2049 primarily reflects the TAP of its 2049 issue that priced +25 bp wide to secondaries. The proceeds of the TAP coupled with a new 10-year offering were used to call the company’s 5.25% 2025 bonds. The deal was leverage neutral and extended LEA’s debt maturity profile. LEA’s ratings are more insulated than in the 2008-2009 downturn, given its much stronger balance sheet and overall lower debt levels. Estimated total leverage is 1.3x and 0.5x on a net basis, which is very strong for the current ratings. Both Moody’s and S&P have stable outlooks on their respective ratings for LEA; S&P noted that a downgrade is unlikely and an upgrade could occur should LEA sustain strong cash flow beyond 2020. Liquidity is solid as LEA had nearly $1.5 billion of cash on the balance sheet and an untapped $1.75 billion revolver (maturing 8/8/23). Additionally, LEA generated free cash of $680 million for the year. LEA’s next maturity is not until 8/8/22 when its amortizing term loan comes due ($234 million outstanding). After the term loan, the next maturity is not until 2027.
eBay Inc. (EBAY – Baa1/BBB+/BBB): EBAY bonds have held in fairly well relative to the index which provides a potential selling opportunity. With the recent sale of StubHub for $4.05 billion (net proceeds of $3.1 billion), gross leverage has increased as proceeds are being used primarily for shareholder remuneration. Share buybacks are now expected to be $4.5 billion for 2020, up from previous guidance of $1.5 billion and in addition to the $5 billion spent in 2019. While leverage remains under the company’s target of 3.0x, management’s focus remains on the shareholder. EBAY‘s Classified business is currently part of a strategic review with an update expected by mid-year. While a sale has been rumored to fetch between $8-to-$10 billion in proceeds, it is likely that proceeds will continue to go towards further shareholder remuneration and/or M&A. Furthermore, gross merchandise volume (GMV) trends remained negative through 2019 as competition remains fierce.
Teck Resources (TCKBCN: Baa3/BBB-): Teck Resources was the second hardest hit issuer in the entire IG Index, with long-dated paper selling off by as much 7-9% (excess return), with spreads over 60-70 bp wider in a single week. The North American coal and precious metals miner is viewed as being among the most directly impacted with over 60% of exports to Asia, roughly 16% of which is specific to China and subject to direct declines in metals prices. Management is reducing output in response to the events over the past two weeks, and was already facing difficult operating fundamentals due to weaker pricing. Bottom-line: TCKBN will undoubtedly remain on the front-lines of further coronavirus volatility, but this is an ideal entry point for longer-term buyers of credit who can withstand further panic over the immediate term.
Brighthouse Financial (BHF: Baa3/BBB+) / Equitable Holdings (EQH: Baa2/BBB+): Annuities exposure was already a sore topic for Life Insurance investors before the equity market saw its worst sell-off since 2011 during the 2/27/2020 session. Investors in BHF (APS – BHF Sept 2019) have long been well protected to the downside risk of potential operating weakness, and/or related downgrades that might threaten its standing as an IG issuer, as it already traded closely in-line with BB rated financial fair value curves. The evaluation acknowledges a negative bias in the credit that has dogged valuations since its inaugural launch in 2017. Bottom-line: The company has sufficient liquidity and cash-flow to withstand near-term weakness related to additional annuity reserves and weaker operating results on a transient basis. There is value in the BHF name over its closest peer EQH, which also sold off heavily in the past week.
Exhibit 6. Bottom 100 issues by spread change (2/19 – 2/27)
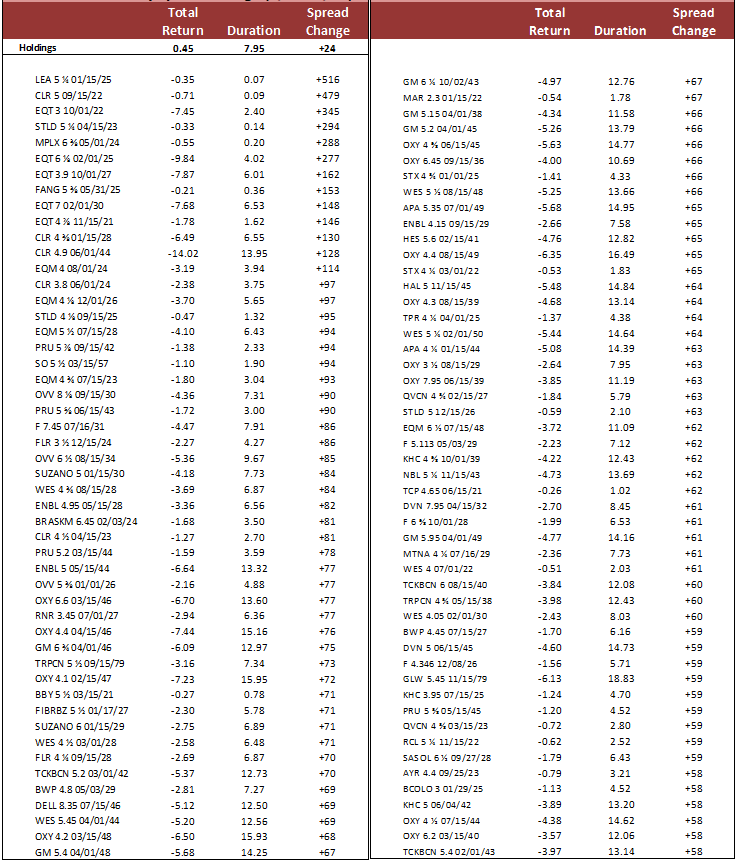
Source: Bloomberg Barclays US Corp Index