


Uncategorized
A narrow path to negative US rates
admin | August 16, 2019
This document is intended for institutional investors and is not subject to all of the independence and disclosure standards applicable to debt research reports prepared for retail investors.
The record tally of global debt trading at negative rates raises the possibility of US rates, too, dropping below zero. There is a path to negative US rates, but an unlikely and very narrow one. The Fed would first have to lower fed funds to zero, relaunch low-for-long guidance and start new rounds of QE. Even then, the Fed could hesitate to break the zero bound. And without sustained negative fed funds, the rest of the curve would have a hard time staying below zero. Still, the curve is not only in the Fed’s hands, and the bullish inversion in Europe shows one way US rates could go negative.
Negative rates, but policy as usual
Central banks have proven that negative rates can be part of policy as usual. Before the 2008 financial crisis, policymakers thought charging bank customers and bond investors to hold their cash would trigger currency hoarding. Faced with depositing $100 today at -1% annually and getting back $99 a year later, for example, policymakers expected households and corporations to figuratively and literally tuck money under the mattress. Funds would drain from banks and bond markets, and lending would plummet.
It hasn’t happened. A record $15.8 trillion of global government and corporate debt now trades at negative rates, with $5.5 trillion alone going negative since US-China trade talks first broke down on May 9. The euro zone, Denmark, Sweden, Switzerland and Japan all at various times have cut their central bank rates below zero. All still have policy rates below zero except Denmark, which stands at zero. Other parts of the yield curve in all of these countries trade further below zero than the policy rate (Exhibit 1).
Exhibit 1: Negative rates in the euro zone, Switzerland and Japan
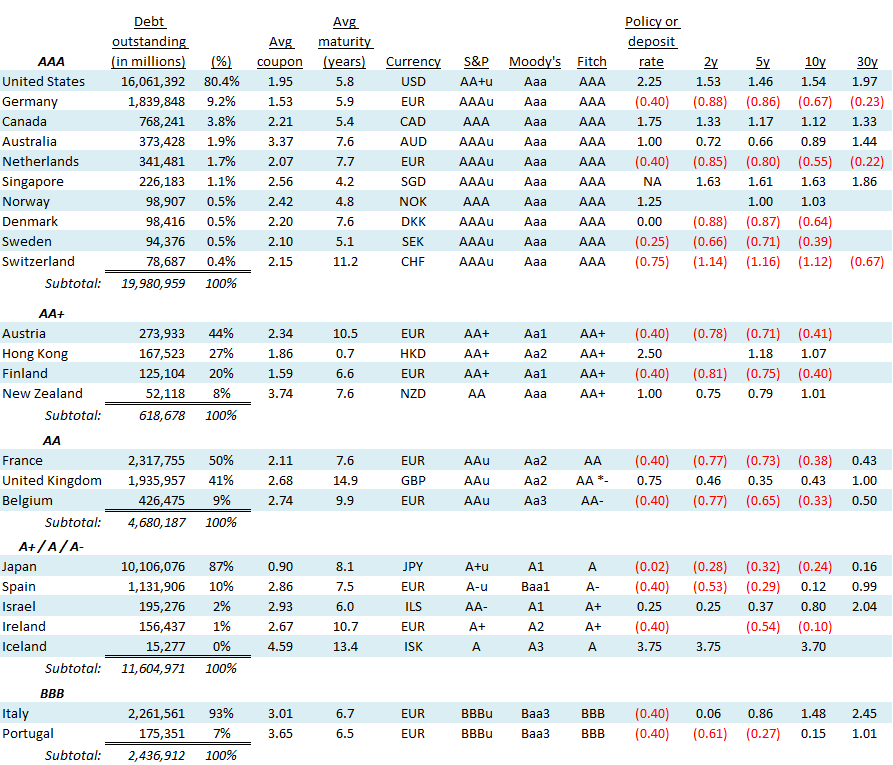
Note: Debt amounts outstanding are in US dollars, as of 8/15/2019. Source: Bloomberg, Amherst Pierpont Securities
Despite breaching the zero bound, monetary policy continues to work and there are no obvious signs of cash hoarding. The public in these countries has not started suddenly converting cash into large denomination bills, according to the Brookings Institution, and the total value of paper money as measured against the size of these economies has not surged. That is promising so far, but a few things muddy the water about whether deeper negative rates could still do damage.
Negative rates so far have been modest, for one thing. The European Central Bank has set its policy rate at -40 bp with Switzerland staking out the extreme at -75 bp. The public may not hoard cash at those rates partly because the cost of holding currency—buying safes, finding insurance and so on—is comparable. Federal Reserve staffers in a 2010 study concluded the annual cost of storing cash in the US runs around 35 bp. Perhaps more importantly, keeping cash in a bank is convenient. The value of bank services, especially for large corporations that have to make timely payments to employees and suppliers and get paid by customers, may be worth the fee. Tucking a small amount of currency under the mattress might be feasible, but a large amount could be uncomfortable in more ways than one.
Many banks in the euro zone have also protected customers from negative rates. While euro zone banks have had to pay the central bank to store excess reserves, many have not passed on the negative rate to retail customers. Deposit rates in Switzerland have generally been floored at zero. Banks have shielded their retail deposit base.
Negative rates as a last resort
Pushing rates even further below zero would test the limits on cash hoarding. The true lower bound on interest rates is the point where negative rates outweigh the cost and inconvenience of hoarding cash. Jean Pierre Danthine, a former vice president at the Swiss National Bank, has argued today’s -75 bp Swiss setting is close to the lower bound. “Negative interest rates are not popular,” Danthine said at a 2016 Brookings conference. “I think what we can conclude is that we cannot go much lower.”
A deeper dive below zero could stress the banking system if banks continued to shield retail deposits. US commercial banks now get 72% of their $15.4 trillion in funding from deposits of $100,000 or less. Shielding those deposits would get expensive.
US policymakers have worried in particular about the effect of negative rates on the roughly $2.4 trillion in government money market funds, something the euro zone and Japan do not have to consider. These funds offer the appearance of price stability by quoting a constant $1.00 net asset value. Negative rates would likely break the buck, forcing the funds to take in $1.00 but return something less. Since these funds play important roles absorbing Treasury supply and funding Treasury repo, the Fed is likely to move cautiously.
Finally, there is risk to public support. Getting low or no interest on a deposit may not be very visible to most of the public. But seeing a deposit balance decline over time might be quite visible and very politically unpopular. The expected lift to the economy from deeply negative rates is abstract, and it would likely be a tough job convincing the public that negative rates ultimately will help.
All things considered, most central banks, and especially the Fed, view negative rates only as a last resort. And the Fed especially has other tools of monetary policy it could use before resorting to negative rates. Not only can the Fed lower rates and use forward guidance, it has a deep and liquid bond market much more amenable to QE than markets in Europe and Japan.
A path to negative US rates
The US market does not trade in isolation, of course, and the market for German debt may shed light on one way US rates could go negative. US Treasury bonds and German Bunds have represented the deepest pools of ‘AAA’ sovereign debt for decades. Yields on similar maturity Treasuries and Bunds tend to move together, with betas typically between 0.6 and 0.9 over time. The yield spread between 10-year Treasuries and 10-year Bunds has tended to reflect differences in Fed and ECB policy rates (Exhibit 2).
Exhibit 2: Treasury and Bund yields tend to reflect Fed and ECB policy rates
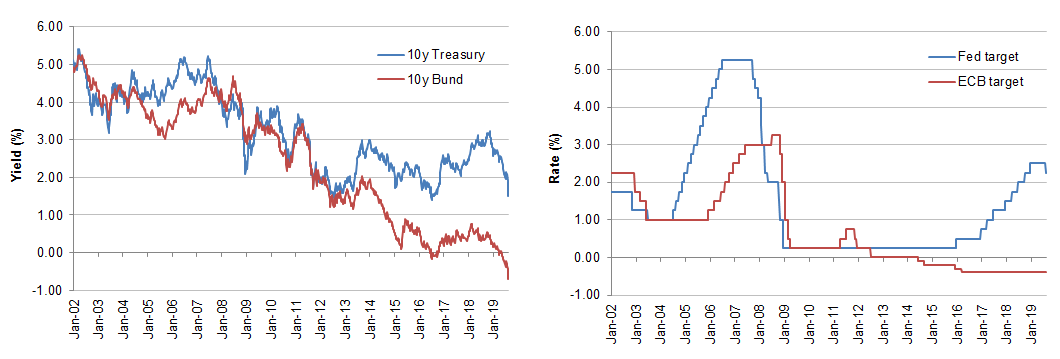
Note: Data is weekly. Source: Bloomberg, Amherst Pierpont Securities
The yield spread between the 10-year Bund and the 10-year Treasury reached a high of 279 bp at the beginning of November 2018, when the Fed was raising rates and projecting further hikes in 2019. That spread has narrowed somewhat and stabilized in the range of 240 bp to 260 bp as Fed policy shifted with US-China trade conflict. The yield spread has narrowed by 10 bp to 15 bp since the Fed cut rates at the end of July.
If the Fed meets market expectations and cuts fed funds further, then the gap between 10-year notes and Bunds should narrow. In all likelihood, that is where the path to negative US rates stops, with rates far from the negative zone. The US economy today is far stronger, better capitalized and more liquid than the economy that led the Fed to the zero bound in the first place. Even if the global trade consensus unravels, the heavy domestic orientation of the US economy should keep fed funds above zero.
Still, QE in Europe has already pushed capital into the US, and new rounds of QE in the US would likely further lower US long-term rates. The German curve already is the most inverted in the euro zone, reflecting its better liquidity and safety. The same thing could be in store for the US. The Fed may draw fed funds toward the zero bound and stop, but the draw of safety and liquidity along with the impact of QE could push the longer parts of the curve lower. The narrow and unlikely path to negative US rates is a bullish inversion.
* * *
The view in rates
Implied volatility in US rates keeps climbing and has now reached the highest point since early 2016. It simply reflects the difficulty of predicting the next twist in trade and, consequently, shifts in potential Fed policy and rates. It’s hard to be bullish or bearish on rates without an inside track on trade policy. Add Hong Kong and Brexit to the mix. Since good investors only take risks they can understand and manage, prudence argues for being neutral. Convexity should continue to perform well. Long positions in volatility should pay.
It is intriguing to think that the bullish flattening and inversion that has been in motion since January could continue. Longer US rates are moving far faster than the Fed. The Fed is focused on the US economy, the long end may be more focused on the global economy. QE and foreign flows into US debt have also distorted the curve and could continue distorting it. The bullish inversion could continue.
The view in spreads
Uncertainty about trade policy makes it difficult to take a strong view in spread products. Initially the US planned to make a final decision in September on proposed 10% tariffs on an incremental $300 billion in Chinese imports. That timing apparently has changed, with the US deferring the decision on at least some imports until December. China, meanwhile, is reportedly preparing a response to the proposed tariffs. Investors in spread products have to be able to ride out the likely higher spread volatility ahead for the balance of the year.
The view in credit
Fundamental credit could be vulnerable in parts of the corporate market sensitive to trade such as technology and communication, energy and commodities. Industries with a domestic US focus look better. Households look even better. As Stephen Stanley pointed out recently, the recent benchmark GDP revisions raised estimates of household income by $400 billion and made the household balance sheet look even stronger than before. Low interest rates have spurred mortgage refinancing, which should further reduce household debt burden. Low rates should also give some support to home prices, which should help homeowners continue building their equity.