Uncategorized
A bullish case for the MBS basis
admin | June 12, 2020
This document is intended for institutional investors and is not subject to all of the independence and disclosure standards applicable to debt research reports prepared for retail investors.
Both the Fed and the Treasury have started heading down paths bullish for the performance of MBS against Treasury debt. The Federal Reserve has already purchased $728 billion of MBS through June 11 and has committed to increasing net holdings by $40 billion a month to ensure smooth market functioning. At the same time, the Congressional Budget Office estimates the Treasury will issue $4.5 trillion in additional debt by June of next year. The combination of Fed buying and Treasury supply could tighten the spread between MBS and the Treasury curve toward some of the narrowest levels seen in years.
The basis tightens as the Fed takes a higher share of outstanding MBS
Fed purchases so far have likely helped tighten the basis by at least 24 bp. Fed researchers have modeled the effect of past MBS purchases on the mortgage basis. For every 1% of outstanding MBS purchased by the Fed, MBS yields dropped 2.3 bp. Since March 1, the Fed has purchased $728 billion MBS, which is roughly 10.6% of all MBS outstanding.
The increasing Fed share has almost certainly helped tighten spreads, although par 30-year OAS has tightened by far more than 24 bp (Exhibit 1). From its widest point on March 19, the par 30-year OAS has run from 150 bp to below 40 bp. The wide print came after the Fed’s March 15 commitment to buy up to $200 billion in agency MBS. On March 23, the Fed committed to buying as much MBS as need to “support smooth market functioning.” It is hard to know how much the market then assumed for Fed purchases. It is also hard to filter out the impact of other investors buying in concert with the Fed. Frictions in origination caused by the coronavirus along with high unemployment and lower growth this year has also likely reduced expectations for net MBS supply.
Exhibit 1: Par 30-year OAS has tightened with Fed buying and other factors
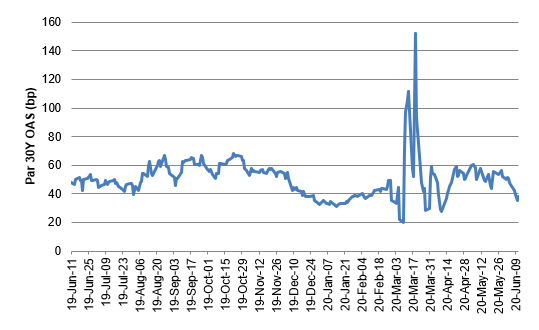
Source: YieldBook, Amherst Pierpont Securities
The Fed’s June 10 commitment to increase MBS holdings by $40 billion a month with no end date should further tighten the basis. Over the next 12 months the Fed’s MBS portfolio should grow by $480 billion, reaching nearly $2.4 trillion in June 2021. That represents 6.6% of the expected outstanding MBS market, assuming outstanding MBS grows to $7.25 trillion by next June. As a result, the basis should tighten 15 bp. Since the close of business on June 9, the basis has tightened from 39 bp to below 30 bp, nearly pricing in most of a year of purchases. The Fed’s commitment to easy financial conditions should keep MBS purchases in place beyond a year.
Tied up in the Fed program are other reasons the Fed could tighten the basis beyond simply holding MBS. The Fed’s purchases remove negative convexity from the private market balance, lowering volatility in private investors’ portfolios. The Fed also typically takes delivery of the most negatively convex MBS pools, lowering the overall negative convexity of MBS available to private portfolios.
Heavy Treasury supply likely to tighten the basis further
All spread products historically tend to tighten when Treasury supply increases. Several researchers have modeled this relationship. For example, this World Bank paper estimates that a 0.9% increase in Treasury supply over 12 months lower 10-year swap spreads by 1 bp.
The CBO publishes a quarterly forecast of Treasury supply, which can be used to estimate how much the basis will tighten. The last official forecast predates the response to the pandemic, but the CBO provided some hints to their Treasury forecast in their monthly GDP forecast published April 24. The CBO expects the debt-to-GDP ratio to increase by 20 percentage points by the end of 2020 and by 26 percentage points by the end of 2021, which implies they expect the outstanding treasury debt to reach roughly $22 trillion in June 2021. That is a $4.5 trillion, or 25.7%, increase from the beginning of March.
Based on a model estimate alone, 10-year swap spreads would tighten by roughly 28.5 bp over the next year. If MBS tightens similarly to swaps, or even at half the estimated pace of swaps, the MBS basis would revisit levels last seen in late 2012, just after the Fed announced an open-ended commitment to buying $40 billion a month in MBS.
This material is intended only for institutional investors and does not carry all of the independence and disclosure standards of retail debt research reports. In the preparation of this material, the author may have consulted or otherwise discussed the matters referenced herein with one or more of SCM’s trading desks, any of which may have accumulated or otherwise taken a position, long or short, in any of the financial instruments discussed in or related to this material. Further, SCM may act as a market maker or principal dealer and may have proprietary interests that differ or conflict with the recipient hereof, in connection with any financial instrument discussed in or related to this material.
This message, including any attachments or links contained herein, is subject to important disclaimers, conditions, and disclosures regarding Electronic Communications, which you can find at https://portfolio-strategy.apsec.com/sancap-disclaimers-and-disclosures.
Important Disclaimers
Copyright © 2024 Santander US Capital Markets LLC and its affiliates (“SCM”). All rights reserved. SCM is a member of FINRA and SIPC. This material is intended for limited distribution to institutions only and is not publicly available. Any unauthorized use or disclosure is prohibited.
In making this material available, SCM (i) is not providing any advice to the recipient, including, without limitation, any advice as to investment, legal, accounting, tax and financial matters, (ii) is not acting as an advisor or fiduciary in respect of the recipient, (iii) is not making any predictions or projections and (iv) intends that any recipient to which SCM has provided this material is an “institutional investor” (as defined under applicable law and regulation, including FINRA Rule 4512 and that this material will not be disseminated, in whole or part, to any third party by the recipient.
The author of this material is an economist, desk strategist or trader. In the preparation of this material, the author may have consulted or otherwise discussed the matters referenced herein with one or more of SCM’s trading desks, any of which may have accumulated or otherwise taken a position, long or short, in any of the financial instruments discussed in or related to this material. Further, SCM or any of its affiliates may act as a market maker or principal dealer and may have proprietary interests that differ or conflict with the recipient hereof, in connection with any financial instrument discussed in or related to this material.
This material (i) has been prepared for information purposes only and does not constitute a solicitation or an offer to buy or sell any securities, related investments or other financial instruments, (ii) is neither research, a “research report” as commonly understood under the securities laws and regulations promulgated thereunder nor the product of a research department, (iii) or parts thereof may have been obtained from various sources, the reliability of which has not been verified and cannot be guaranteed by SCM, (iv) should not be reproduced or disclosed to any other person, without SCM’s prior consent and (v) is not intended for distribution in any jurisdiction in which its distribution would be prohibited.
In connection with this material, SCM (i) makes no representation or warranties as to the appropriateness or reliance for use in any transaction or as to the permissibility or legality of any financial instrument in any jurisdiction, (ii) believes the information in this material to be reliable, has not independently verified such information and makes no representation, express or implied, with regard to the accuracy or completeness of such information, (iii) accepts no responsibility or liability as to any reliance placed, or investment decision made, on the basis of such information by the recipient and (iv) does not undertake, and disclaims any duty to undertake, to update or to revise the information contained in this material.
Unless otherwise stated, the views, opinions, forecasts, valuations, or estimates contained in this material are those solely of the author, as of the date of publication of this material, and are subject to change without notice. The recipient of this material should make an independent evaluation of this information and make such other investigations as the recipient considers necessary (including obtaining independent financial advice), before transacting in any financial market or instrument discussed in or related to this material.


