


Uncategorized
Hold ‘AAA’, tread cautiously in ‘BB’ and sell the rest
admin | June 12, 2020
This document is intended for institutional investors and is not subject to all of the independence and disclosure standards applicable to debt research reports prepared for retail investors.
The average CLO ‘AAA’ trades in the secondary market these days at fair value, based on Amherst Pierpont models of CLO debt spreads, with other classes except ‘BB’ trading rich. The average ‘BB’ looks undervalued, but it is hard to argue that any model can fully account for the idiosyncrasies of failed overcollateralization tests and diverted cash flow. Hold CLO ‘AAA’, tread cautiously in ‘BB’ and sell the rest.
CLO ‘AAA’ looks slightly wide to fair value
The average CLO ‘AAA’ has traded in the secondary market in recent sessions only 8 bp wide of fair value based on a model of CLO spreads that accounts for rating, structure, loan portfolio attributes, manager and general market conditions (Exhibit 1). ‘AAA’ last traded close to fair value in early March. By late March, the Amherst Pierpont trading desk framed ‘AAA’ paper as trading at spreads between 375 bp to 625 bp, with buyers and sellers in many cases electing not to publicly report levels. Modeled fair value for ‘AAA’ paper in late March stood at a spread of around 250 bp. As loan prices rallied sharply after late March, fair value moved quickly back towards 200 bp and tighter. Continuing public reports of trades at wider levels widened the gap between fair value and secondary spreads by late April to 65 bp. The gap has since largely closed.
Exhibit 1: CLO ‘AAA’ debt trades in secondary only 8 bp wide of fair value
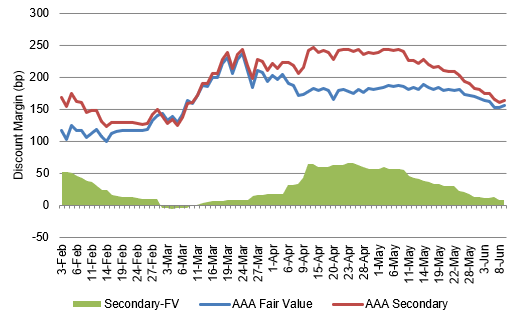
Note: Fair value estimated by a model based on rating, CLO structure, loan portfolio attributes, manager and general market conditions. A description is here. AAA secondary spreads estimated based on model estimate and the rolling 30-day difference between model estimates and publicly reported secondary market trades. Source: Amherst Pierpont Securities
Beyond modeled fair value, CLO ‘AAA’ paper also looks slightly wide to fair value against CMBS ‘AAA’ (Exhibit 2). CLO ‘AAA’ is trading roughly between spreads of 140 bp to 190 bp with CMBS ‘AAA’ at 126 bp. CMBS ‘AAA’ has tightened to CLO ‘AAA’ since late May by 25 bp. With the average spread between the two benchmarks at 31 bp over the last five years and the median spread at 34 bp, the current CLO ‘AAA’ average spread of roughly 168 bp puts the current spread at 42 bp, roughly between 11 bp to 8 bp wide to fair value.
Exhibit 2: CLO ‘AAA’ is trading 8-11 bp wide to fair value against CMBS ‘AAA’
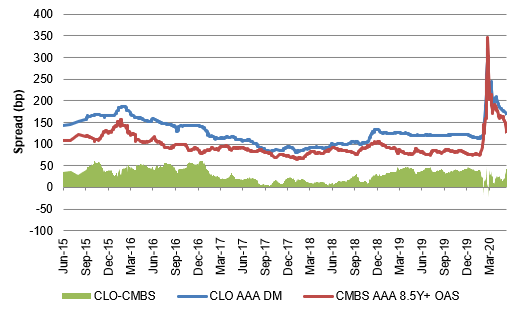
Source: Palmer Square, Bloomberg, Amherst Pierpont Securities
CLO ‘AAA’ paper does have exposure to failed overcollateralization tests and diverted cash flows, but it is a case of both good news and bad news. The good news for ‘AAA’ is that failed tests usually mean the ‘AAA’ will get early return of principal. That lowers the notional balance of principal exposed to exceedingly remote default risk and shortens the maturity of the default option. The bad news is that a failed test usually means the MVOC of the entire structure has dropped, exposing every class to more risk in the underlying leveraged loans. Early return of principal probably outweighs a lower MVOC in ‘AAA,’
CLO ‘AAA’ debt still has good prospects for seeing tighter spreads. CLOs should get some lift from relative value investors, but the bigger lift should come from the broad prospects for higher quality risk assets. With the Fed’s commitment at the June FOMC to buy at least $80 billion a month in Treasury debt, $40 billion a month in MBS and maintain its pace in agency CMBS, the supply of the highest quality assets should continue to shrink. More investors should get squeezed into the highest quality CMBS, ABS and CLOs.
CLO ‘AA’ to ‘BBB’ look rich
Mezzanine investment grade CLO paper looks rich to fair value. ‘AA’ paper over the last 30 days has averaged nearly 50 bp tight to fair value, ‘A’ paper has averaged nearly 140 bp tight and ‘BBB’ paper has averaged nearly 280 bp tight (Exhibit 3).
Exhibit 3: CLO ‘AA’, ‘A’ and ‘BBB’ paper has recently traded tight to fair value
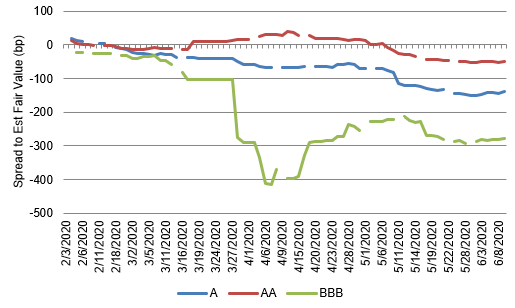
Note: Fair value estimated by a model based on rating, CLO structure, loan portfolio attributes, manager and general market conditions. A description is here. AAA secondary spreads estimated based on model estimate and the rolling 30-day difference between model estimates and publicly reported secondary market trades. Source: Amherst Pierpont Securities
This is roughly echoed in the nominal spreads between the different classes of CLOs. ‘AA’ debt has recently tightened sharply to ‘AAA,’ ‘A’ has tightened to ‘AA’ and ‘BBB’ has tightened to ‘A’ (Exhibit 4). The spread between ‘AA’ and ‘AAA’ is now tight to its 5-year average and median, the spread between ‘A’ and ‘AA’ is slightly wide to the 5-year average and median, and the spread between ‘BBB’ and ‘A’ is still wide to those benchmarks. However, ‘BBB’ debt currently has much more exposure to failed overcollateralization tests and diverted cash flow than in the past. Historic nominal spreads and ranges do not reflect the higher risk, so ‘BB’ debt should trade wide to historic ranges. The same is true to a lesser extent for ‘A’ paper. As for ‘AA’ paper, it seems hard to argue it should trade tighter than its historic spread to ‘AAA’ for now. ‘AA’ paper is not fundamentally stronger or more liquid than it has been in the past. It is higher yielding, and it does have a higher beta to overall risk spreads. Yield and beta may be the reason for the tightening in all of these investment grade mezzanine classes.
Exhibit 4: Mezzanine IG CLO debt has tightened significantly to CLO ‘AAA’
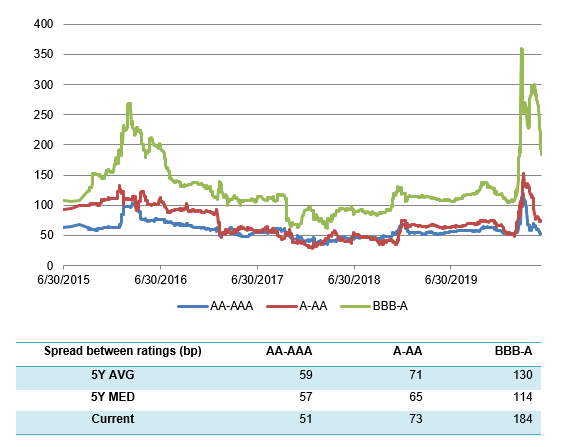
Source: Palmer Square, Bloomberg, Amherst Pierpont Securities
Tread cautiously through ‘BB’
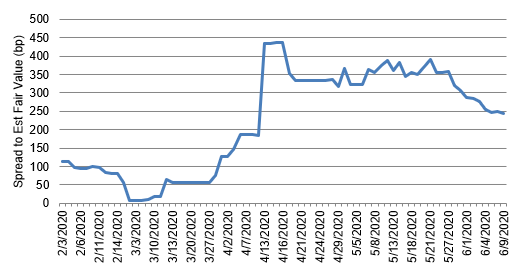
Finally, CLO ‘BB’ looks wide to fair value, but our tools may not capture the current distinct risks in each ‘BB’ class. In markets over the last few years, current secondary spreads in ‘BB’ paper would look 250 bp wide to fair value (Exhibit 5). But the last few years has not included many cases of sharply rising ‘CCC’ exposure, thinning overcollateralization buffers or rating agency actions to downgrade CLOs or put them on negative outlook. Our fair value model might signal that the average CLO ‘BB’ is undervalued, but, for practical purposes, there is no average ‘BB’ these days. The details of collateral, triggers and manager potential to correct fail tests should drive value in ‘BB.’
Exhibit 5: CLO ‘BB’ paper looks wide to fair value, but the details matter
Note: Fair value estimated by a model based on rating, CLO structure, loan portfolio attributes, manager and general market conditions. A description is here. AAA secondary spreads estimated based on model estimate and the rolling 30-day difference between model estimates and publicly reported secondary market trades. Source: Amherst Pierpont Securities