Uncategorized
Ranking CLO managers by rating actions
admin | June 26, 2020
This document is intended for institutional investors and is not subject to all of the independence and disclosure standards applicable to debt research reports prepared for retail investors.
Moody’s has put nearly 25% of CLO classes on CreditWatch Negative since January and downgraded nearly 5%. But the rating actions do not fall evenly across managers. A tenth of managers have more than 43% of their debt on CreditWatch Negative while more than three tenths have nothing on the bubble. Managers that came into the coronavirus crisis with stronger loans and delivered better returns than the broad market also tended to avoid negative actions. Their debt should trade with more liquidity and at tighter spreads.
Who’s hot and who’s not in Moody’s rating actions
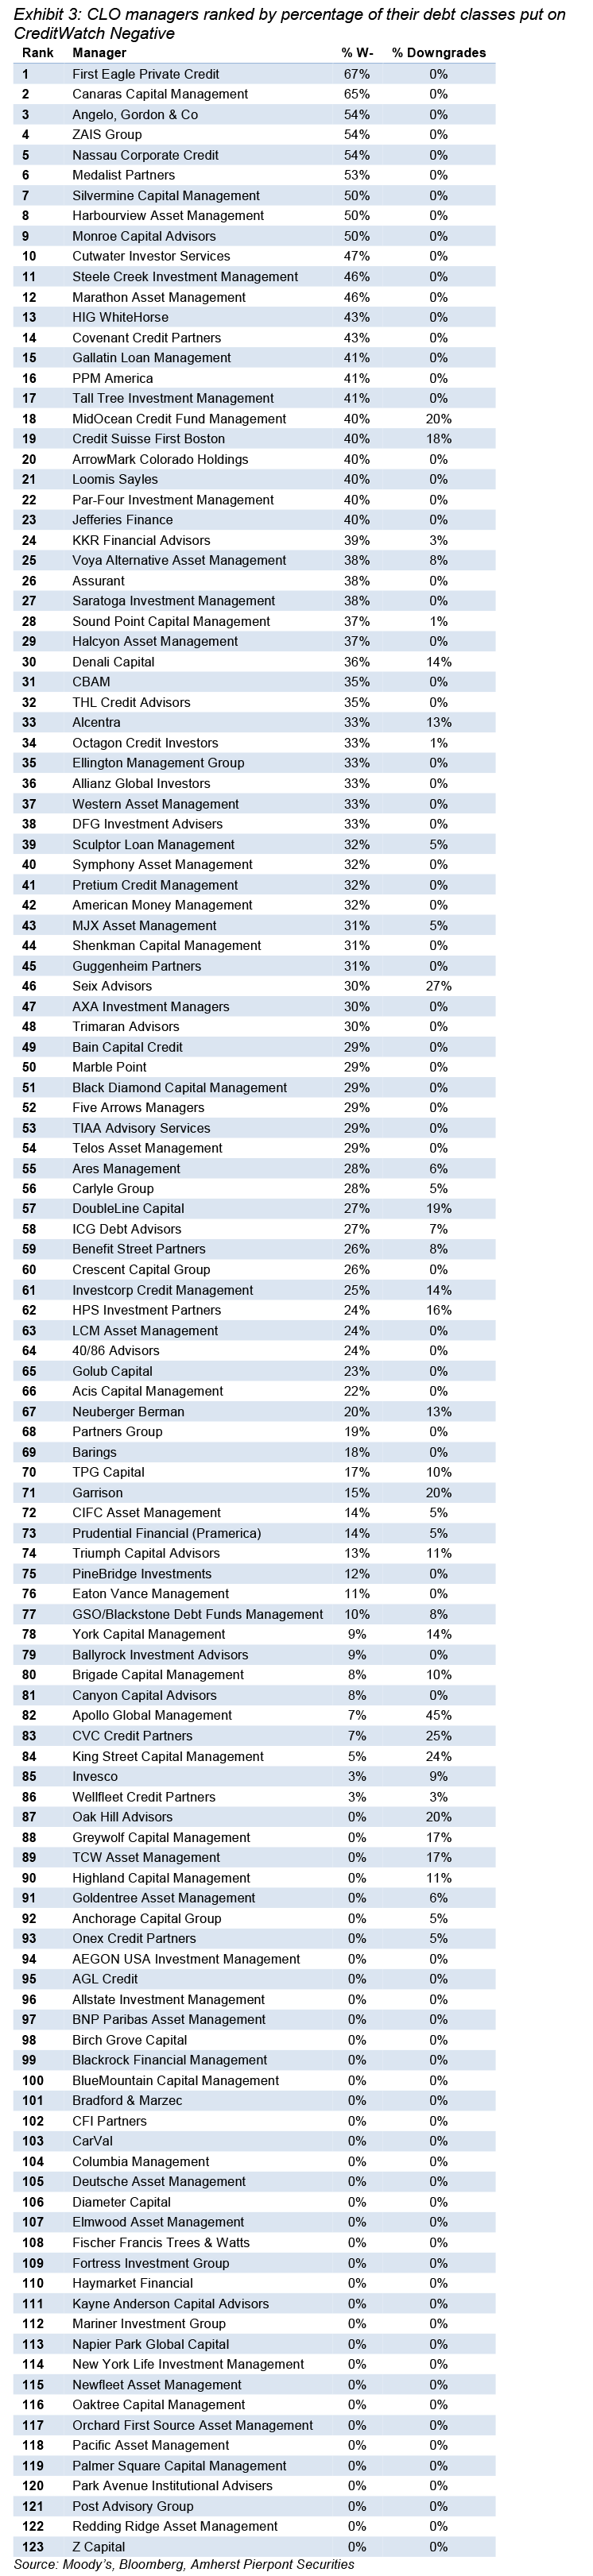
Manager has clearly mattered in the rating agency actions through the coronavirus crisis. The average manager had 35 Moody’s-rated CLO classes outstanding in January. Of those, Moody’s has since put 24.5% on CreditWatch Negative and downgraded 4.8%. But the range is significant (Exhibit 1). The top decile of managers ranked by percent of classes on CreditWatch Negative has 43% or more on watch, the bottom decile has 0%. In fact, the bottom three deciles have 0%. The top decile ranked by percent downgraded has 14% or more getting hit, the bottom decile has 0%.
Exhibit 1: Big differences across active managers in Moody’s-rated CLO classes put on CreditWatch Negative since January, and in classes downgraded
Source: Moody’s, Bloomberg, Amherst Pierpont Securities
It is also notable that the incidence of classes going CreditWatch Negative and classes getting downgraded since January is only loosely related. A good share of managers with the highest percentage of classes on CreditWatch Negative have no downgrades, and a good share of managers with heavy downgrades have little or no other classes on CreditWatch Negative. If Moody’s has tagged the right classes to put on watch, those measures should line up better in the future.
Also notable is the 30 out of 123 active managers that have no classes on CreditWatch Negative and no classes downgraded. Despite a 1-in-4 chance of CreditWatch negative for the average manager and a 1-in-20 chance of downgrade, these 30 have escaped unscathed so far.
Scratching at the surface of why
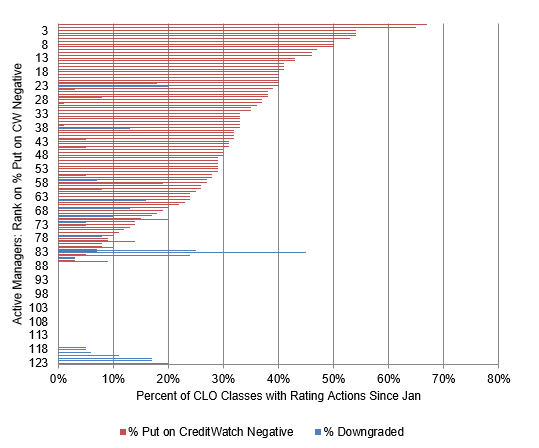
The most important factor by far in predicting later CreditWatch Negative actions was a manager’s weighted average loan price in January (Exhibit 2). Managers holding higher priced loans saw their debt go CreditWatch Negative at a lower rate than managers holding lower priced loans. With a correlation of -0.64, variation in loan price accounted from more than 41% of variation in the share of CLO classes going CreditWatch Negative.
The second most important factors were managers’ exposure in January to defaulted loans and the managers’ ability from January through June to outperform the broad leveraged loan market. More defaulted loan exposure predicted more CreditWatch Negative, and more excess return predicted fewer actions. Neither are entirely independent of loan price. Defaulted loans tend to have lower prices, and managers with higher prices tended to generate more excess return from January through June. However, these factors add to the explanation for CreditWatch Negative actions.
A third tier of factors includes the managers’ broad market sensitivity or beta, their diversity score and bid depth. Higher beta and higher diversity leaned a manager toward more rating actions, lower values had the opposite effect. Higher bid depth lowered the risk of negative actions.
Finally, managers’ AUM and second lien exposure had no effect.
Exhibit 2: The weighted average price of loans in a manager’s portfolio in January correlated most strongly with later CreditWatch Negative actions, followed by exposure to defaulted loans and the managers Jan-Jun alpha
Source: Amherst Pierpont Securities
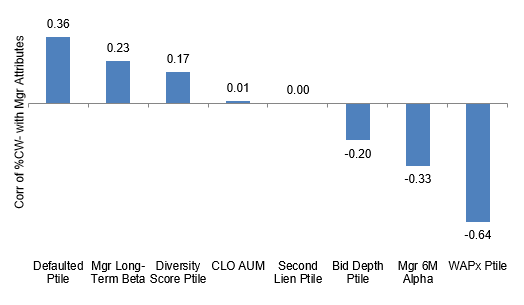
At this point in the coronavirus crisis, it is difficult to put a finger on the key triggers for actual downgrade, at least using simple correlation. Only 4.8% of the January universe of outstanding Moody’s-rated CLOs have met this fate (Exhibit 3). With 24.5% on CreditWatch Negative, however, we will likely have more cases to work with in the future.
If investors fully attribute ratings outcomes to the decisions made by CLO managers both before and through coronavirus, than managers clearly matter. Managers with stronger portfolios and better-than-market performance have also been among those with the fewest negative rating actions. The market tends to like good news, or alternatively, no bad news. These managers should trade with better-than-average liquidity and with tighter-than-average spread.