


Uncategorized
It still makes sense to play defense
admin | July 10, 2020
This document is intended for institutional investors and is not subject to all of the independence and disclosure standards applicable to debt research reports prepared for retail investors.
It was all risk-on in June with the lowest-rated, longest-dated and some of the highest-risk issuers dominating investment grade corporate performance throughout the month. IG corporate credit provided 2.00% excess return in June, offsetting the modest back-up in Treasury rates for a total return of 1.96%. Finance companies and REITs led the way. But it still makes sense to pay defense.
It is important to guard against letting the most recent data sway investment decisions, or risk running into the inevitable fulcrum in market technicals. Risk-adjusted performance offers a better perspective on how portions of the market have performed throughout the year. The best measure is the Sharpe ratio using the day-to-day average and standard deviation of returns year-to-date. The summaries below provide a look back at risk-adjusted performance, highlighting both standouts and underperforming segments of the Index. Below we conclude with a recap of our current sector recommendations, which include a change in the Consumer sector, but overall maintain the defensive tone that we adopted at the start of the Covid-19 crisis.
Not surprisingly, Sharpe Ratios by sector are heavily defined by the volatility experienced throughout the initial credit sell-off in 2020 (Exhibit 1). The recovery so far has failed to push excess returns for the year into positive territory. Returns over the most recent months have been insufficient to offset the high degree of volatility in higher risk segments including Energy, Finance Companies, REITs, and Basic Materials. Since we are using risk-adjusted total returns for our calculations as opposed to excess returns, the volatility in the Treasury curve is contributing to overall risk factors as well. Nevertheless, as the results demonstrate, Sharpe Ratios are by no means entirely susceptible to duration risk, as several of the longer-dated sectors within the index still score among the top in overall risk-adjusted performance.
Exhibit 1: Sharpe ratios by corporate credit sector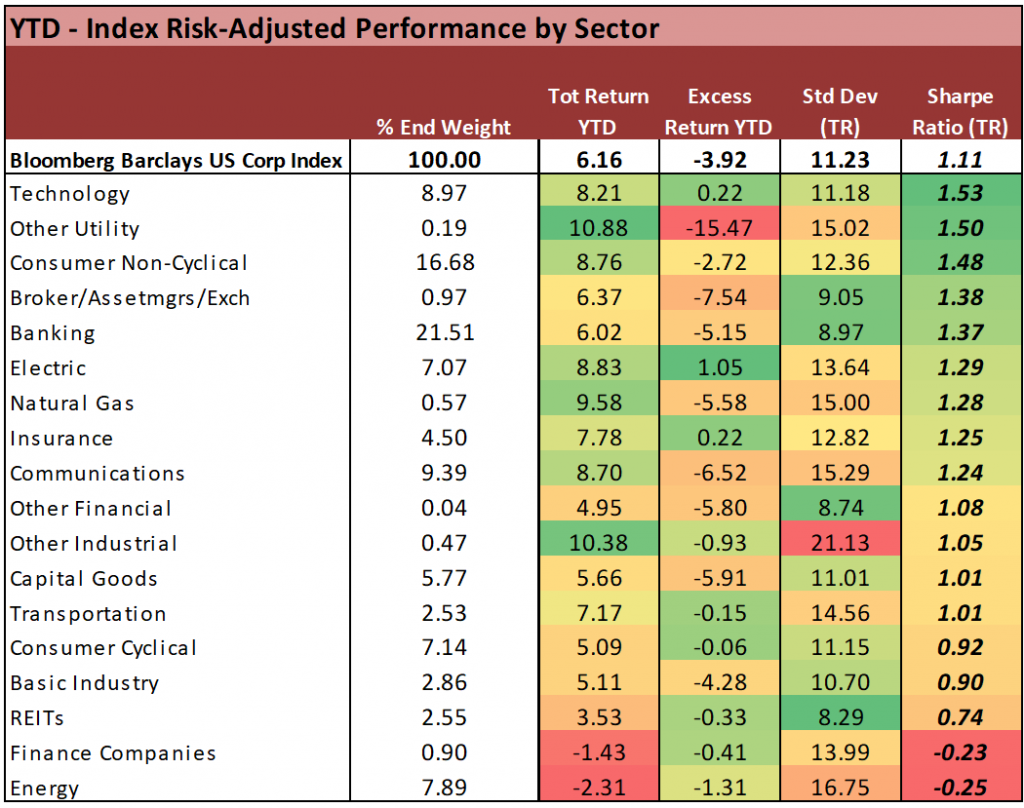
Source: Bloomberg Barclays US Corp Index
Technology
Proving that cash is king in volatile times, the technology sector continues to be the best performing sector in the index year-to-date on a risk-adjusted basis, with the highest Sharpe ratio of 1.53. The majority of technology credits entered the pandemic with strong balance sheets underscored by large net cash positions. Additionally free cash flow generation continues to remain robust, allowing them to weather through these uncertain times with relatively few hiccups. As investor demand for higher quality debt continues, many technology names have taken advantage of said demand at extremely attractive rates, further bolstering their liquidity position.
Apple Inc. (AAPL – Aa1/AA+) leads its peer constituents with a net cash position of $83 billion as of 3/28/20. AAPL tapped the market on 5/4/20 for $8.5 billion with proceeds of the deal earmarked for general corporate purposes, which we believe will likely go to shareholders via buybacks and dividends. Even with a shareholder friendly agenda, as AAPL targets a net cash neutral position over time, it’s unlikely for AAPL to get there any time soon as street estimates call for nearly $63 billion of free cash flow generation this year. Shareholder rewards on a LTM basis, while sizeable at $87 billion, will require a little time for AAPL to chip away at its cash position. Even with AAPL’s 1.65% 5/11/30 bond trading at roughly 66bps (1.27% yield) we still see value relative some single A consumer non-cyclical names like PepsiCo (PEP – A1/A+). Currently PEP 1.625% 5/1/30 is trading a couple of basis points through AAPL on a g-spread basis, despite the fact that AAPL is rated 3 notches higher.
While the implementation of the Fed’s corporate credit facilities has provided support to the entire credit spectrum—including recent fallen angels as well as lower BBB credit at risk of falling out of the investment grade index—these efforts have not been enough to offset the volatility of the initial sell-off and lingering concerns that we retest the lows in another Covid-19 related sell-off event. Even as we have rallied for three consecutive months, there still remains a highly evident dichotomy within the market, whereby investors remain reluctant to embrace the highest beta corners of the IG Index (Exhibit 2). This is evident in day-to-day trading patterns, including when the market is seeing spreads tighten as much as 10 bp in a single session, while high beta individual credits are demonstrating acute resistance to those buying pressures.
Exhibit 2: Sharpe ratios by corporate rating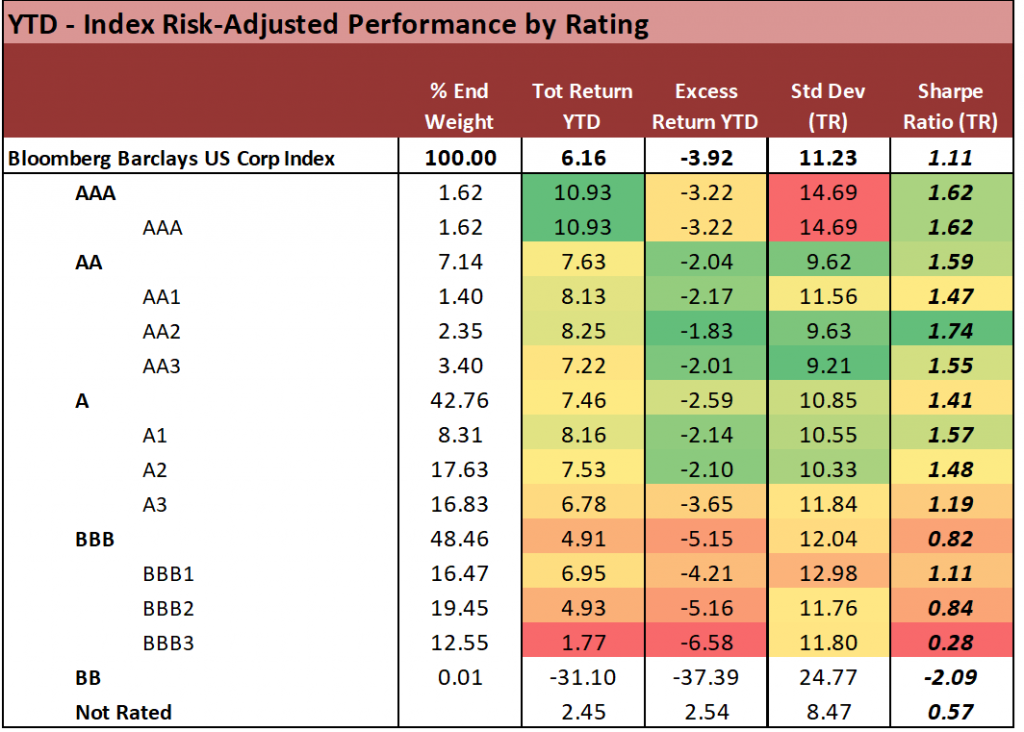
Source: Bloomberg Barclays US Corp Index
Consumer non-cyclical
Another top performer in the index with a Sharpe ratio of 1.48, consumer non-cyclical names have benefitted largely from consumer pantry-stocking during the pandemic. Items such as toilet paper and hand sanitizer were hard to come by for nearly two months while packaged food names got a much needed boost in demand for their products. On the packaged food front, many of these names were struggling to post organic growth which led to debt fueled acquisitions and leverage elevated for their largely BBB ratings. Yet post acquisition, organic growth was still not materializing as consumer preferences for more natural, organic foods was leading the consumer away from “middle of the store” items. However once the pandemic hit, stay at home orders largely forced a consumer need for shelf stable items to limit trips to the grocery store.
Campbell Soup Company (CPB – Baa2/BBB-/BBB(n)) witnessed unprecedented demand across their brands in fiscal 3Q which fueled a 17% organic growth rate. Prior to the pandemic, CPB had been looking for its organic growth rate for the full year to be in the range of down 1% to up 1%, as growth had been relatively flat in the first two fiscal quarters. Now CPB believes it can post a full year organic sales growth rate of 5.5%-6.5%. CPB’s largest contribution came from the meals and beverages business unit which saw organic sales up 21%. This was largely driven by 35% growth in soup sales in the quarter, a division that had been struggling for years. That said, soup household penetration was up nearly 10 percentage points in the quarter with the largest increase witnessed across the millennial generation. Additionally, adjusted EBIT was up 31% in the quarter, thereby helping management with its deleveraging story. CPB reduced its net debt position by $2.9 billion year to date via asset sale proceeds, bringing net debt to the $5.5 billion level. CPB’s net leverage ratio is now 3.2x and not far off its 3.0x net leverage target by year end 2021.
CPB’s return performance thus far has been good with a Sharpe ratio of 1.81 and slightly ahead of peer General Mills’ (Baa2/BBB/BBB (n)) ratio of 1.67. GIS also ended the quarter with net leverage of 3.2x which we note was ahead of their 3.5x target for fiscal year end 2020. Both seem set to achieve their 3.0x net leverage target within the next 12 months, but CPB continues to lag GIS from a spread perspective. We see value in a swap out of GIS 4.7% 4/17/48 bonds and into CPB 4.8% 3/15/48 for a pick-up of nearly 25bps. In 5yr CDS, we note that GIS trades only 10bps through CPB.
Again, the use of total return risk factors for our Sharpe ratio calculations carries a substantial duration component, but looking at the excess returns logged in each of the maturity buckets concludes that the use of a pure based credit return would have yielded similar results for risk-adjusted performance by maturity (Exhibit 3).
Exhibit 3: Sharpe ratio by maturity
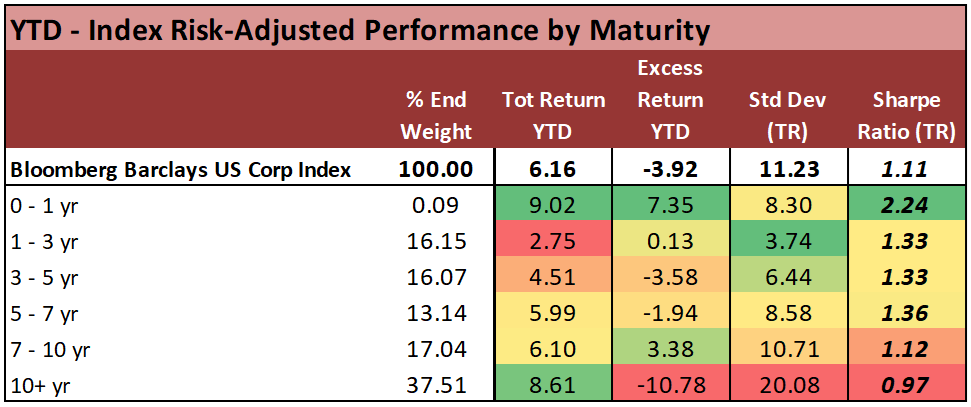
Source: Bloomberg Barclays US Corp Index
Top Sharpe Ratios by Issuer include an interesting mix of both defensive credits, as well as names with higher volatility that have simply outperformed on a credit basis (Exhibit 4). It’s worth noting that part of that cohort includes names that may have been thinly traded ahead of the sell-off, but ultimately benefited from a new issue in the early months of the rally, which provided an outsized performance in the weeks that followed. Examples of those include APO and FHN, the latter of which we highlighted in a buy opinion piece shortly after its issuance (APS Strategy: love-it-or-flip-it). APO 2.65% ‘30s A-/A) were issued on June 1 at a level of +200/10yr, and still appear to have good relative value to their peer group at a current indicated level of +195-190. (The bottom 25 is an unsurprising mix of credits, including: a) industries that may exhibit the most lasting impacts of the Covid-19 crisis (AAL, UAL, SAVE, RCL), b) high risk energy with deteriorating credit fundamentals (OXY, EQT, CVECN, PTEN), c) highest beta retail/consumer (M, JWN, KHC, F), d) REITs with long-term occupancy risks (SVC, EPR, SKT).
Exhibit 4: Sharpe ratio by selected issuers
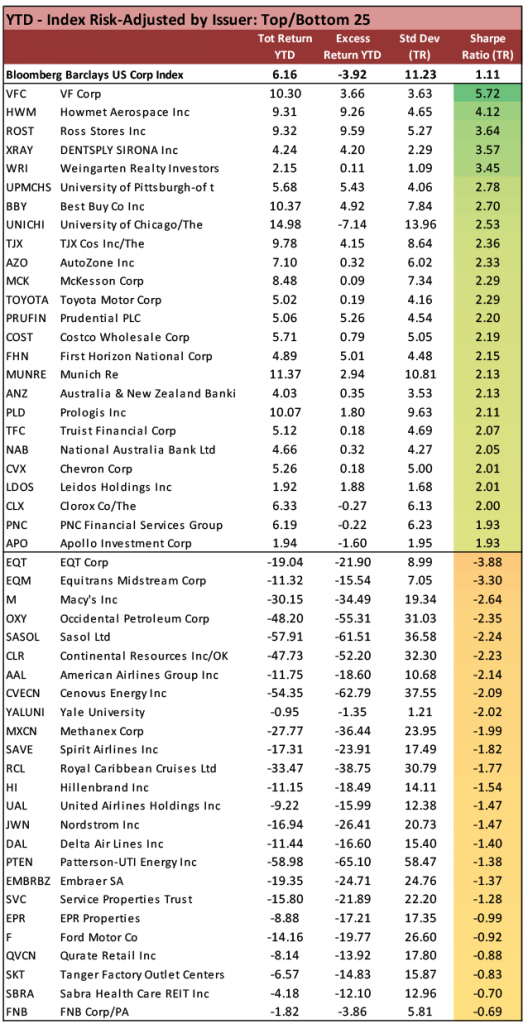
Source: Bloomberg Barclays US Corp Index
Consumer cyclical
We recently moved to a market perform (from underperform) on the consumer cyclical space as we believe the reopening of states will lead to some outperformance in some higher quality retail credits that were forced to price deals at much wider levels despite having strong balance sheets. Retail credits that were considered “essential” (like Home Depot – HD – A3/A-) were allowed to remain open and serve customers through the pandemic. However apparel retailers including department stores and off price retailers were forced to shut their doors, relying on their online units solely for sales. While consumer cyclical YTD Sharpe ratio is currently 0.92 and in the bottom five of sectors, if you drill down on an issuer level, two of the top three best performers in the index were consumer cyclical credits VF Corp. (VFC –A3 (n)/A(n) ) and Ross Stores (ROST – A2/BBB+(n)).
We note that ROST entered the pandemic with a very strong balance sheet as it was in a net cash position (excluding leases). However, with its brick and mortar stores shut and no real presence online, ROST was forced to tap the market at very wide levels when it looked to beef up liquidity. With uncertainty surrounding when it would be able to open its doors to customers, management felt it was prudent to tap the market to further improve its cash position. While ROST bonds have made a considerable move tighter, we believe off-price retail and dollar stores will outperform retail peers as we continue to navigate this time of economic uncertainty. One thing we learned with the financial crisis is that economic downturns benefit off price retailers/dollar stored as more consumers are forced to make their dollar stretch, thereby searching for value.
In looking at ROST relative to its closest peer TJX Companies (TJX – A2(n)/A(n)), we note that ROST 10/30s curve is much steeper than TJX. ROST 10/30s curve is currently worth 81bps versus 37bps at TJX. We believe 2H sales could pick up as stores reopen and sales should exceed full price peers, as they were doing prior to the pandemic. TJX and ROST will also benefit from being able to secure pack away inventory from full priced peers as they look to clear merchandise they were not able to sell during the pandemic. That said, we expect ROST management to continue with its conservative financial policy and look to further cut costs to boost margins. Improved results will help ROST 10/30s curve flatten closer to TJX, in our view.
Sector recommendations for July
We are changing the sector recommendation on Consumer Cyclical to Market Weight from Under Weight (Exhibit 5). Otherwise, we remain in a more defensive posture, reflecting our concerns about the longer-term global economic fallout of COVID-19 outbreak and related earnings volatility, with the prospect for recurring spikes in volatility for the near-to-intermediate term. The compounded stress on energy/commodity markets is making it extremely difficult to time fluctuations in valuation among commodity credits, which further supports a call overweighting more defensive segments within the index. With the re-pricing of credit risk year-to-date, the long-term valuation proposition in higher rated, less cyclical credits is compelling enough to forego more aggressive strategies that remain susceptible to shorter-term swings in volatility.
Exhibit 5: Sector recommendations for July
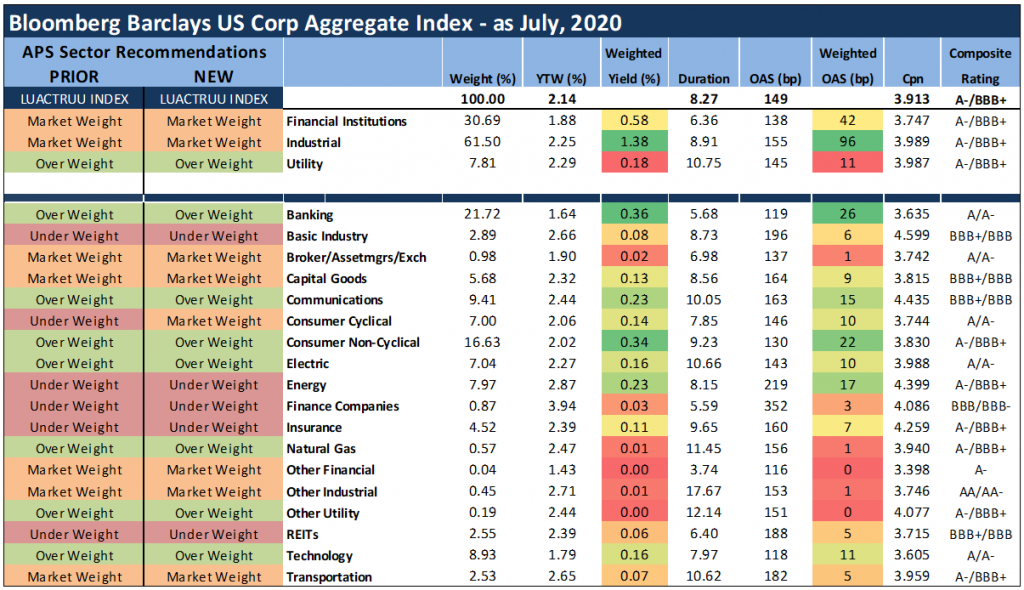
Source: Amherst Pierpont, Bloomberg/Barclays US Corp Index