


Uncategorized
Managers ride the leveraged loan rally through June
admin | July 10, 2020
This document is intended for institutional investors and is not subject to all of the independence and disclosure standards applicable to debt research reports prepared for retail investors.
The rally in the leveraged loan market from April to June has helped more than 55% of CLO managers outperform the broad market. The average CLO loan portfolio gained 1.7% and, after adjusting for broad market exposure, or beta, outperformed the market by 0.1%. Managers who carried portfolios with stronger loans and had better track records at the end of March delivered more excess returns than their peers in the ensuing three months. Managers whose deals originated in 2019 also tended to deliver significantly better returns in the market between April and June.
Loan returns rose sharply in April then plateaued in early May before picking up the pace in June (Exhibit 1). The Index has now reached about 95% of its pre-coronavirus level. After accounting for the various reporting dates of managers, the S&P/LSTA Index gained 1.7% between April and June. These managers held portfolios with an average beta of 1.03, which meant the average manager should have gained 1.8%. With the actual average performance at 1.9%, the average manager outperformed the index by 0.1%.
Exhibit 1: Loan returns have recovered 95% of pre-Covid level
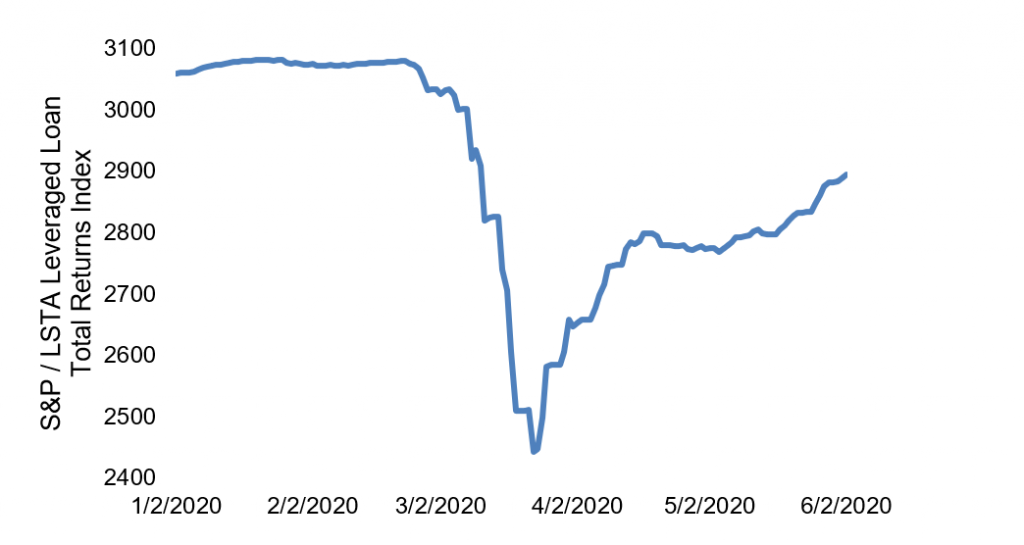
Source: Bloomberg, Amherst Pierpont Securities
More than 55% of the managers outperformed the index, a small uptick from the figures reported by APS last month (Exhibit 2). Out of those managers, 15% delivered alphas higher than 1%. The managers who lagged the index saw a greater dispersion. Over 35% of the managers trailed the index by at least 1%.
Exhibit 2: More than half of the managers outperformed the index between April and June
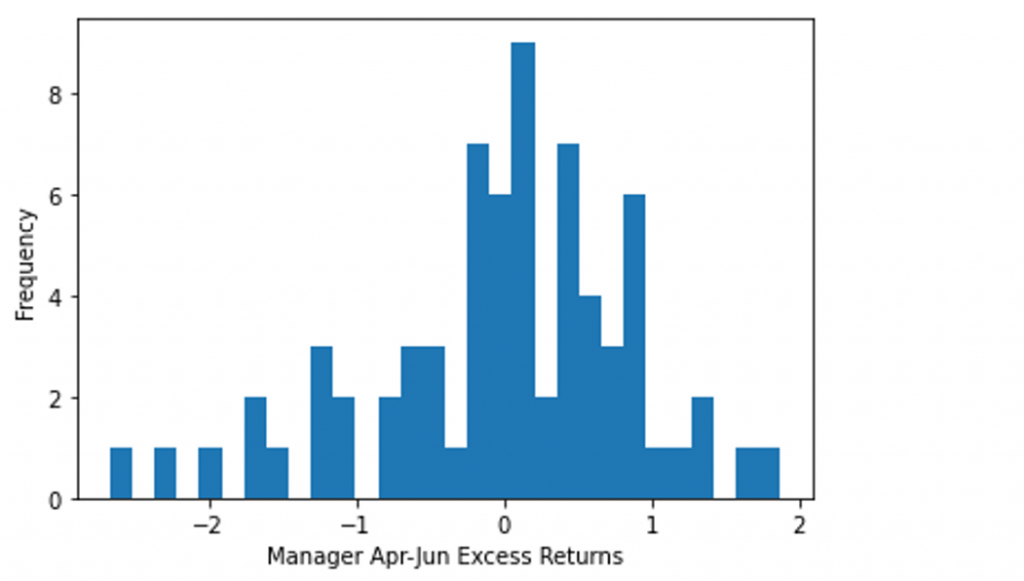
Note: data shows excess return only for active deals. Source: Amherst Pierpont Securities.
The weighted loan price and the bid depth of the portfolios correlated most highly with recent excess returns (Exhibit 3). Managers who held higher priced and more liquid loans tended to deliver more excess returns. Additionally, lower weighted average spread, lower exposure to ‘Caa1’ and defaulted loans, and a track record of outperforming the broad market also correlated with more excess returns. Exposure to sectors most vulnerable during the pandemic, such as retail, energy, and hotel, only had moderate relationships with recent excess returns.
Exhibit 3: Correlation of portfolio or manager features with recent excess return

Note: data shows the correlation of manager or loan portfolio attribute with managers’ excess return or alpha from April through June only on active deals. Portfolio attributes measured as percentiles. Source: Amherst Pierpont Securities.
Managers whose deals originated in 2019 also delivered notably more excess returns on average (Exhibit 4). On the other hand, managers whose deals first started in 2015 or prior barely performed in line with its peers between April and June. Deals of vintage 2015 or prior saw worsening credit amid the energy crisis of 2016 and became especially vulnerable during the pandemic.
Exhibit 4: Deals of newer vintage tended to show more excess returns
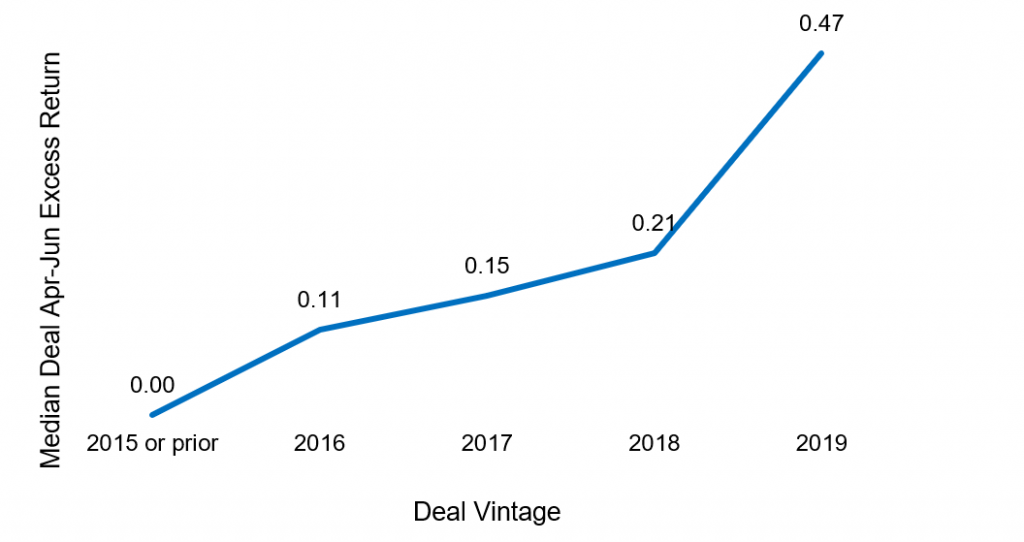
Source: Bloomberg, Amherst Pierpont Securities
The following managers delivered positive alpha in the market between April and June (Exhibit 5). Palmer Square ranked in the top five according to APS reports since March and stayed ahead this time. The others include Goldentree, Halcyon, PineBridge, Prudential, and Octagon.
Exhibit 5: Alpha leaders in CLO portfolio performance April-June 2020
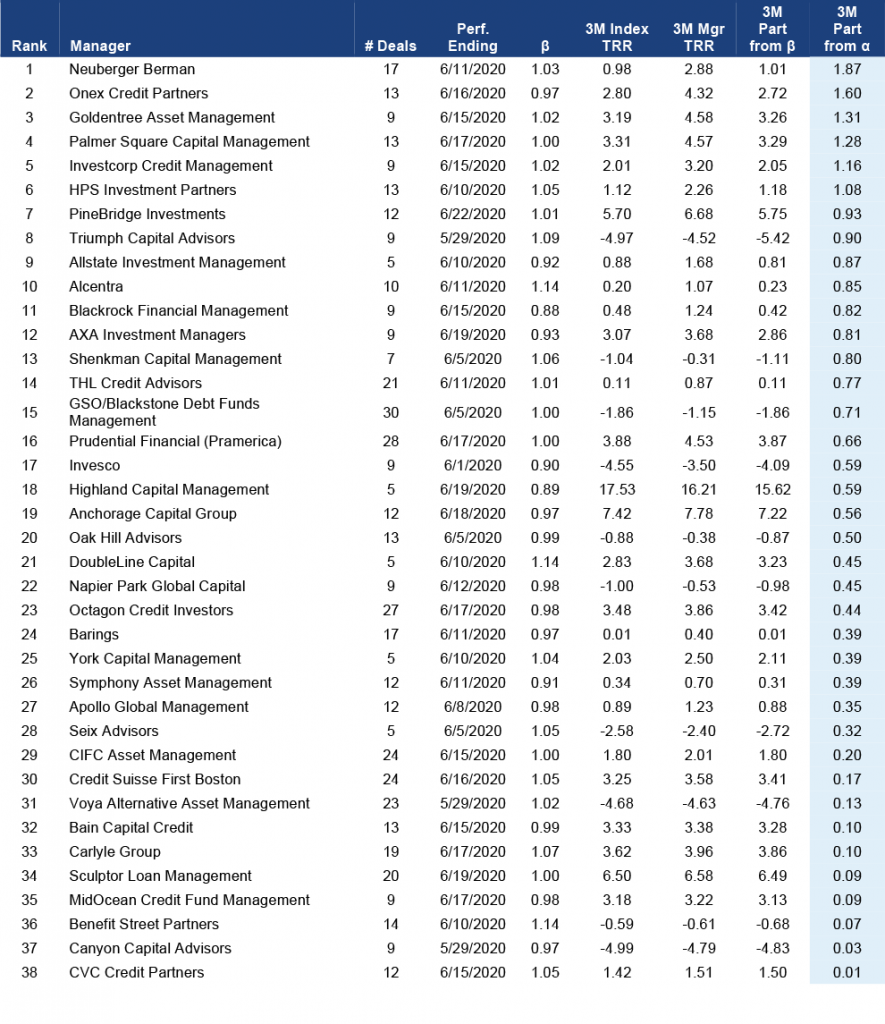
Note: Performance for managers with five or more deals tracked by APS. Performance attribution starts with calculated total return on the leveraged loan portfolio held in each CLO for the 3-month reporting period ending on the indicated date. CLOs, even with a single manager platform, may vary in reporting period. The analysis matches performance in each period to performance over the identical period in the S&P/LSTA Leveraged Loan Index. Where a deal has at least 18 months of performance history since pricing and no apparent errors in cash flow data, the analysis calculates a deal beta. The deal beta is multiplied by the index return to predict deal return attributable to broad market performance. Where no beta can be calculated, the analysis uses the average beta across each manager’s active deals weighted by the average deal principal balance over time. Any difference between performance attributable to beta and actual performance is attributed to manager alpha. Source: Amherst Pierpont Securities.