Uncategorized
Sell 30-year 2.0%s, pick up carry or convexity in 15-year paper
admin | July 31, 2020
This document is intended for institutional investors and is not subject to all of the independence and disclosure standards applicable to debt research reports prepared for retail investors.
Portfolios that can use the TBA dollar roll can move from 30-year 2.0% into 15-year 1.5% pass-throughs and pick up valuable carry. For portfolios that cannot use the dollar roll, including most banks, moving from 30-year 2.0%s into 15-year 2.0%s picks up better convexity at a small concession in spread.
Par 30-year paper tightens to par 15-year
Since the beginning of July, the 30-year par MBS spread to the Treasury curve has tightened more than 16 bp with the 15-year par spread in only 2 bp. That has left 30-year pass-throughs tight to 15-year (Exhibit 1). In fact, 30-year paper has closed tighter to 15-year paper in less than 10% of trading sessions over the last five years.
Exhibit 1: The par 30-year pass-through in July tightened sharply to the 15-year
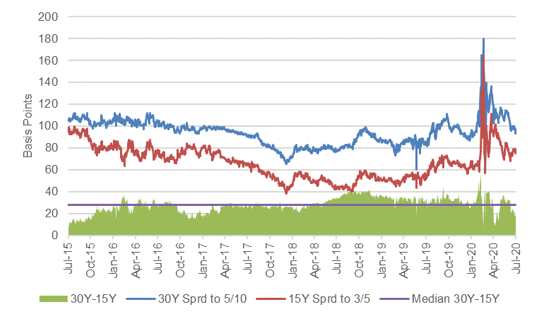
Source: Bloomberg, Amherst Pierpont Securities
Still tight after adjusting for the yield curve
Of course, 30-year pass-throughs trade off a longer part of the yield curve than 15-year pass-throughs, so a flattening of the yield curve could tighten spreads without indicating a change in relative value. It is important to adjust for the slope of the yield curve. After adjusting, 30-year paper still shows as tight (Exhibit 2).
Exhibit 2: Par 30-year paper still seems tight after accounting for yield curve slope
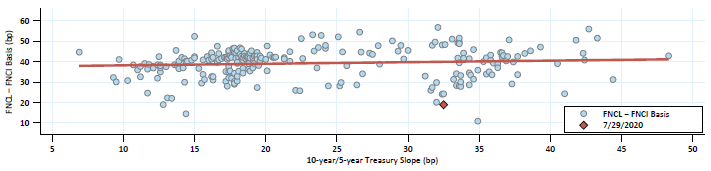
Source: Amherst Pierpont Securities
Weighing the dollar roll
Investors can now pick up the better convexity of 15-year pass-throughs with a narrow concession in spread. However, the details of the dollar roll in TBA 30- and 15-year pass-throughs are important for constructing the trade, as is the ability of the investor to roll the position.
Both TBA 30- and 15-year pass-throughs closest to par now roll special in light of the Fed’s steady bid, offering extra carry for portfolios that roll the position (Exhibit 3). The FNCL 2.0%s roll 2.75/32s special from August to September, the FNCI 2.0%s roll 1.50/32s special, and the FNCI 1.5%s roll 4.35/32s special. The best position in these coupons depends on a portfolio’s ability to roll.
Exhibit 3: Pass-through nearest to par in 30- and 15-year MBS currently roll special

Note: All market levels as of 7/30/20, 10:50 AM. Assumptions for roll calculations include a 0.13 cost of funds, 2 CPR prepayment rate and a 0.13 reinvestment rate. Source: Bloomberg, Amherst Pierpont Securities.
For portfolios that can dollar roll, the 15-year 1.5% paper looks the best as long as the special roll persists. Steady Treasury rates and a likely declining primary-secondary mortgage spread should mean steady production of FNCI 1.5% paper, a steady Fed bid and, consequently, a special roll.
For portfolios that cannot dollar roll, the 15-year paper 2.0% paper looks like good relative convexity at an inexpensive price. Taking TBA-quality FNCL 2.0% pools means the non-rolling investor is implicitly paying for prospective future special financing that the portfolio cannot use. The same holds for TBA-quality FNCI 1.5% pools. Find some inexpensive FNCI 2.0% specified pools and hold them.
This material is intended only for institutional investors and does not carry all of the independence and disclosure standards of retail debt research reports. In the preparation of this material, the author may have consulted or otherwise discussed the matters referenced herein with one or more of SCM’s trading desks, any of which may have accumulated or otherwise taken a position, long or short, in any of the financial instruments discussed in or related to this material. Further, SCM may act as a market maker or principal dealer and may have proprietary interests that differ or conflict with the recipient hereof, in connection with any financial instrument discussed in or related to this material.
This message, including any attachments or links contained herein, is subject to important disclaimers, conditions, and disclosures regarding Electronic Communications, which you can find at https://portfolio-strategy.apsec.com/sancap-disclaimers-and-disclosures.
Important Disclaimers
Copyright © 2024 Santander US Capital Markets LLC and its affiliates (“SCM”). All rights reserved. SCM is a member of FINRA and SIPC. This material is intended for limited distribution to institutions only and is not publicly available. Any unauthorized use or disclosure is prohibited.
In making this material available, SCM (i) is not providing any advice to the recipient, including, without limitation, any advice as to investment, legal, accounting, tax and financial matters, (ii) is not acting as an advisor or fiduciary in respect of the recipient, (iii) is not making any predictions or projections and (iv) intends that any recipient to which SCM has provided this material is an “institutional investor” (as defined under applicable law and regulation, including FINRA Rule 4512 and that this material will not be disseminated, in whole or part, to any third party by the recipient.
The author of this material is an economist, desk strategist or trader. In the preparation of this material, the author may have consulted or otherwise discussed the matters referenced herein with one or more of SCM’s trading desks, any of which may have accumulated or otherwise taken a position, long or short, in any of the financial instruments discussed in or related to this material. Further, SCM or any of its affiliates may act as a market maker or principal dealer and may have proprietary interests that differ or conflict with the recipient hereof, in connection with any financial instrument discussed in or related to this material.
This material (i) has been prepared for information purposes only and does not constitute a solicitation or an offer to buy or sell any securities, related investments or other financial instruments, (ii) is neither research, a “research report” as commonly understood under the securities laws and regulations promulgated thereunder nor the product of a research department, (iii) or parts thereof may have been obtained from various sources, the reliability of which has not been verified and cannot be guaranteed by SCM, (iv) should not be reproduced or disclosed to any other person, without SCM’s prior consent and (v) is not intended for distribution in any jurisdiction in which its distribution would be prohibited.
In connection with this material, SCM (i) makes no representation or warranties as to the appropriateness or reliance for use in any transaction or as to the permissibility or legality of any financial instrument in any jurisdiction, (ii) believes the information in this material to be reliable, has not independently verified such information and makes no representation, express or implied, with regard to the accuracy or completeness of such information, (iii) accepts no responsibility or liability as to any reliance placed, or investment decision made, on the basis of such information by the recipient and (iv) does not undertake, and disclaims any duty to undertake, to update or to revise the information contained in this material.
Unless otherwise stated, the views, opinions, forecasts, valuations, or estimates contained in this material are those solely of the author, as of the date of publication of this material, and are subject to change without notice. The recipient of this material should make an independent evaluation of this information and make such other investigations as the recipient considers necessary (including obtaining independent financial advice), before transacting in any financial market or instrument discussed in or related to this material.


