


Uncategorized
Transitioning after pandemic
admin | November 20, 2020
This document is intended for institutional investors and is not subject to all of the independence and disclosure standards applicable to debt research reports prepared for retail investors.
The US corporate debt market approaches the coming year at almost the same spreads that it began the current year, but the path in between and the aftereffects look far from typical. Investors in 2021 should face a market with heavy net supply as issuers switch from building liquidity to debt-funded buybacks and M&A. Net leverage should rise. Parts of brick-and-mortar retail should outperform by becoming part of the online value chain. Some REITs should surprise to the upside, technology should outperform again and even some aircraft lessors should add something extra to corporate portfolio performance.
Strong net supply and rising leverage, but still strong demand
Gross issuance of US investment grade corporate debt next year should drop materially from 2020, but the decline in net supply should be much smaller. The key reason for the smaller net decline is that use of proceeds should shift somewhat dramatically from the early redemption of maturing debt to other corporate purposes, including debt-funded share repurchases and large-scale M&A. The implication is that aggregate net leverage will increase in 2021. The capacity to do so may be aided by further recovery in corporate cash flows across a number of key industries in the earlier phases of recovery. Heavy net supply and rising leverage should still get readily absorbed by strong demand for yield.
One of the biggest stories in investment grade corporates for 2020 has been the record new issue volume helped by extraordinarily low rates, seemingly endless investor appetite for yield and the government’s credit programs enacted in the earlier phases of the Covid-19 pandemic. As of the second week in November, gross supply for USD investment grade corporate bonds stands at approximately $1.8 trillion, on pace to potentially break $1.9 trillion by year-end (Exhibit 1). That compares with $1.2 trillion in the prior year and a 5-year average for gross volume of approximately $1.3 trillion.
Exhibit 1: Gross USD IG corporate debt issuance
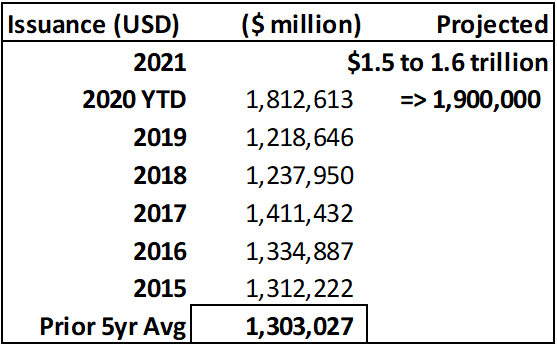
Source: Amherst Pierpont, Bloomberg LP – LEAG tables
Harder to quantify and more important to the performance of corporate debt for investors is always the net supply of new bonds issued into the investment grade market. Net supply quantifies the total volume of new debt net of maturities, early redemptions and debt downgraded to non-investment grade. Using a basic, unadjusted measurement of past and present investment grade Index par value size, we estimate that the total size of net debt issued in 2020 is roughly $967 billion year-to-date. This is the equivalent of about a 10% YoY gain on top of the $8.71 trillion total par amount outstanding as of year-end 2019 to a current level of about $9.26 trillion. This is a simplification of actual float of outstanding investment grade USD corporate debt, but a safe proxy for the purposes of gauging market impact.
Throughout the record-breaking issuance months of the late spring and summer, a large portion of the collective use of proceeds was focused on the early redemption of debt through tender offer. Corporate management teams wisely used the low rate environment to term out approaching debt maturities and even targeted longer-term debt maturities with higher coupons in order to reduce overall borrowing costs and create more efficient capital structures. Some issuers even returned multiple times over the April to October stretch, taking advantage of the credit recovery throughout most of that period.
Exhibit 2: Global M&A volume and deal count could see an uptick in 2021
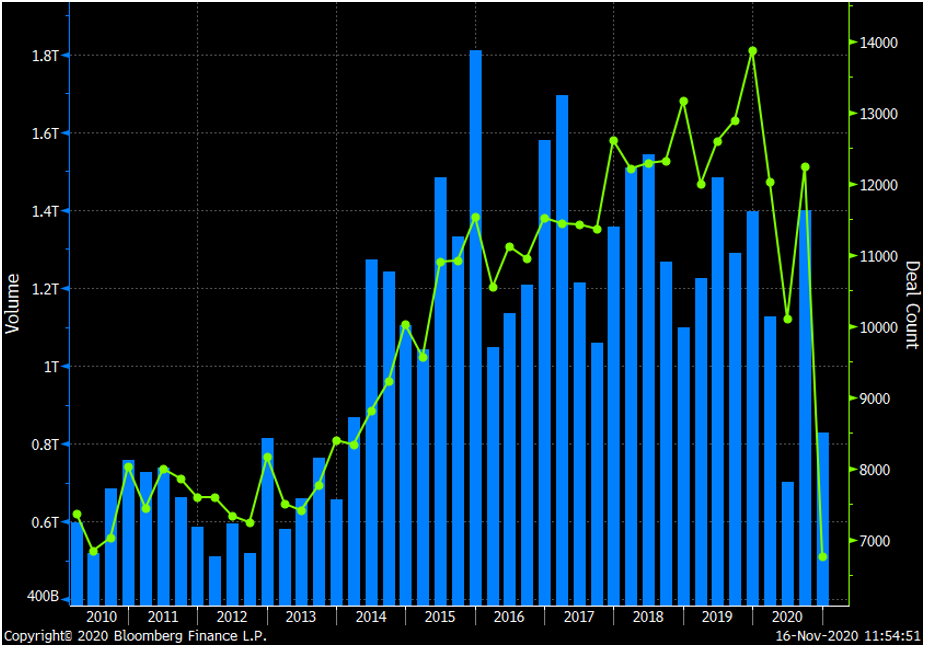
Source: Bloomberg LP
To start estimating net supply next year, we ran a Bloomberg screen to provide the estimated totals of all outstanding bonds with IG ratings maturing in the subsequent four years. Those totals are provided in Exhibit 3 below, with a three-year debt maturity estimate of $2.8 trillion as of year-end 2019. Running the same screen as of the second week of November, we estimate a three-year total of $2.6 trillion for the upcoming three years (2021, 2022, 2023). Corporate issuers’ efforts to fund upcoming debt maturities via tender offer are also observable on the chart. The 2021 maturities dropped to $837 billion from $1.0 trillion as of year-end 2019 (net -$169 billion). The 2022 maturities dropped to $892 billion from $941 billion as of year-end 2019 (net -$50 billion). Therefore, if we see gross volume for 2021 USD issuance drop to an expected range of $1.5 – 1.6 trillion (roughly -15-20% YoY), it is possible we may only see net supply fall to a range of $870 to 920 billion (or roughly -5-10% YoY).
Exhibit 3: Upcoming maturities for IG Issuers – current vs last year end
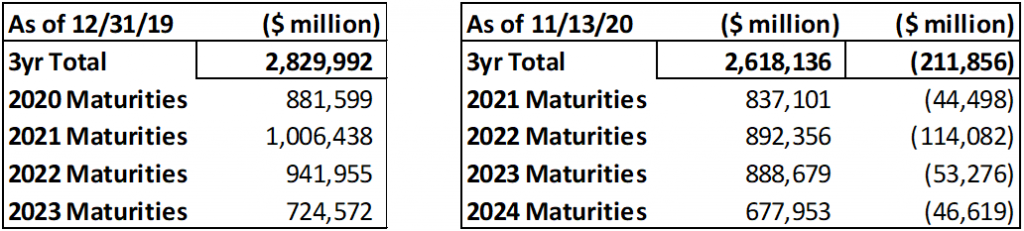
Source: Amherst Pierpont, Bloomberg LP
Shareholder remuneration returns at the expense of the balance sheet
Even with a global pandemic, a contested presidential election and record corporate bond issuance, US investment grade spreads appear to be poised to end the year not far off from where they started. While issuance was initially used to beef up liquidity in the face of pandemic uncertainty and stay-at-home orders, we saw a shift to maturity and coupon management as investor demand for paper seemed insatiable. The term “leverage neutral” seemed almost ubiquitous with each new deal announced, as management teams took advantage of both low rates and demand to smooth maturity walls and reduce overall interest costs with concurrent tender offers. New deals announced in the third quarter were used to tender for debt issued at the height of the pandemic, underscoring how far spreads rallied as lockdowns were lifted. Many management teams suspended share buybacks to enhance liquidity at the start of the pandemic as it was uncertain if the credit markets would remain open. Now with balance sheets largely in order and maturity schedules smoothed, even among some of the lower rated IG credits, management teams seem to be itching to restart share repurchases.
Certain sectors benefitted more than others from stay at home mandates. It is no surprise that packaged food names and essential operators, such as grocers, witnessed strong growth this year as the pandemic forced many to cook at home. Retailers with a strong online presence also witnessed explosive growth as the mad scramble to secure household necessities such as PPE, paper goods and cleaning supplies were scarce. We also saw a shift in the DIY movement as home dwellers tackled repair projects and renovations to occupy their time. Although Covid cases continue to rise across the country, now that we have a vaccine in sight, the potential to get back to a “new normal” seems like it could happen sooner than later. Sectors that benefitted from lockdown restrictions will likely find it hard to replicate their strong top line and EBITDA growth in 2020. With improved liquidity profiles and lower leverage, we could see management teams begin to shift away from balance sheet strengthening and more to shareholder remuneration to support their equity prices.
In the packaged food space, many credits entered 2020 with excessive leverage for their ratings given M&A activity in 2018 and 2019. Packaged food names were struggling to post organic growth, even as they digested recent acquisitions pre-pandemic. Absent the pandemic, we had largely expected packaged food to begin another round of acquisition activity before hitting leverage targets. However, strong year-to-date revenue growth due to pantry stocking, in some cases hitting double digits, helped to expand EBITDA enough that coupled with debt reduction, credits like General Mills (GIS) and Campbell Soup (CPB) are within their low 3x leverage targets. Given the non-discretionary nature of packaged food, investors will continue to view this sector as a safe haven, even absent further lockdown restrictions. That said, we think packaged food will still be able to tap the market at very attractive rates given the overall rate environment. As we look at the equity performance of the ‘BBB’ packaged food space relative to the SPX Index, we highlight that only Conagra Foods (CAG) and to a slight extent, GIS have outperformed. We find this interesting as last year most names had outperformed the SPX despite the net sales underperformance.
Exhibit 4. Packaged Food Equity performance Relative to SPX
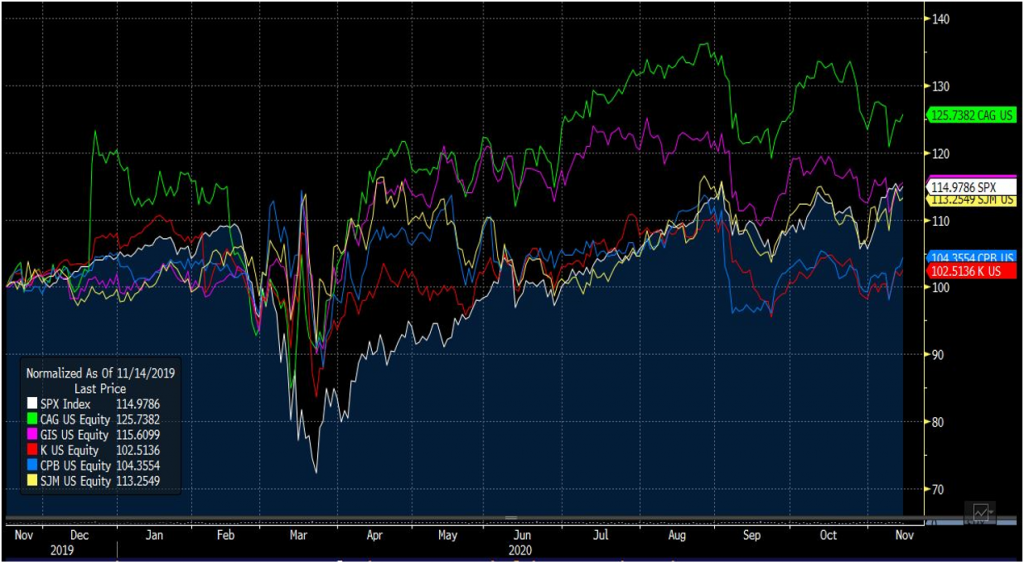
Source: Bloomberg; APS
In our view, CAG may be the only credit in the above chart that will continue to focus on debt reduction for most of the year as it does not expect to achieve its leverage target of 3.5x-3.6x until 3Q21. However, management recently indicated that they are committed to a long-term balanced approach to capital allocation and noted that they have greater financial flexibility to return cash to shareholders, evidenced by their recent 29% increase in the quarterly dividend. While all the credits highlighted in the above chart have refrained from share repurchases this year (with the exception of small amounts to offset dilution), CAG is the only one not yet close to its leverage target while SJM is currently below their 3.0x leverage target. Prior to recent acquisition activity, we note that all of the above credits were actively repurchasing shares as highlighted by the following chart. We see the most value in the CAG credit at current levels and see little room for further upside in the GIS credit.
Exhibit 5: Share repurchase activity 2016-2020 (YTD)
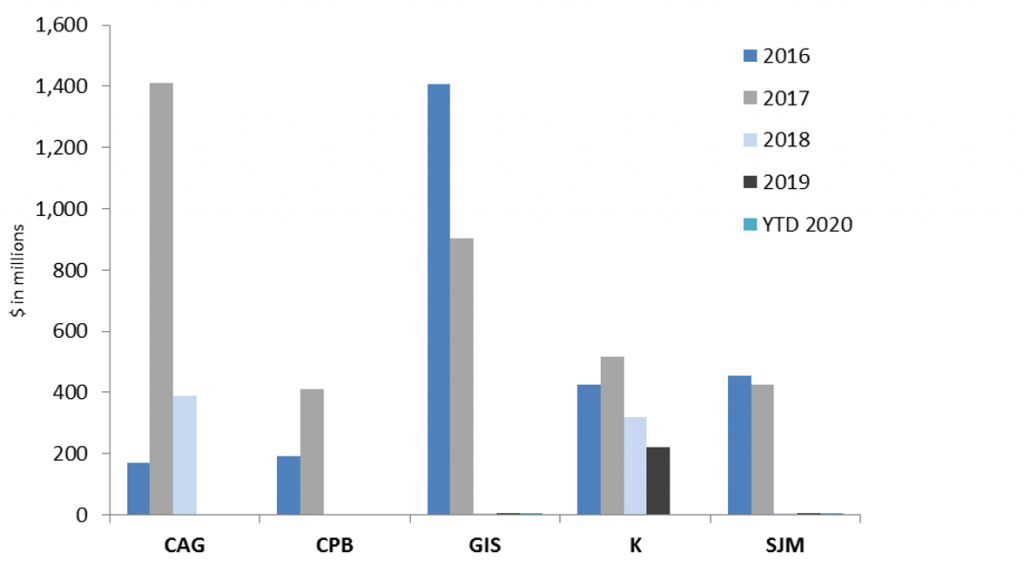
Source: Company Reports, Bloomberg LP, Amherst Pierpont
Brick-and-mortar is not necessarily dead
Although online shopping is not a new phenomenon, the pandemic clearly accelerated the shift to online buying, especially for late adopters, as many brick and mortar stores were deemed non-essential and shut for the early part COVID. However, those consumers who still did not fully understand the omni-channel shopping experience, most likely got a taste during lockdown. While online sales increased dramatically during COVID, in some cases over 200%, it was the buy online pick-up in store option (BOPIS) that saw the biggest gains. Consumers are now using the BOPIS option at more than 4x greater than they were pre-pandemic, with BOPIS growth peaking in April to a level of 6x from the previous year. April online orders were up 193% while BOPIS purchases were up 563% YoY. That trend continued in May with online orders up 194% while BOPIS orders were up 554%. BOPIS now accounts for a much larger percentage of online orders than it did in the previous year, a trend that continued in June even as many stores had reopened to customer traffic.
Exhibit 6. BOPIS share of total online orders
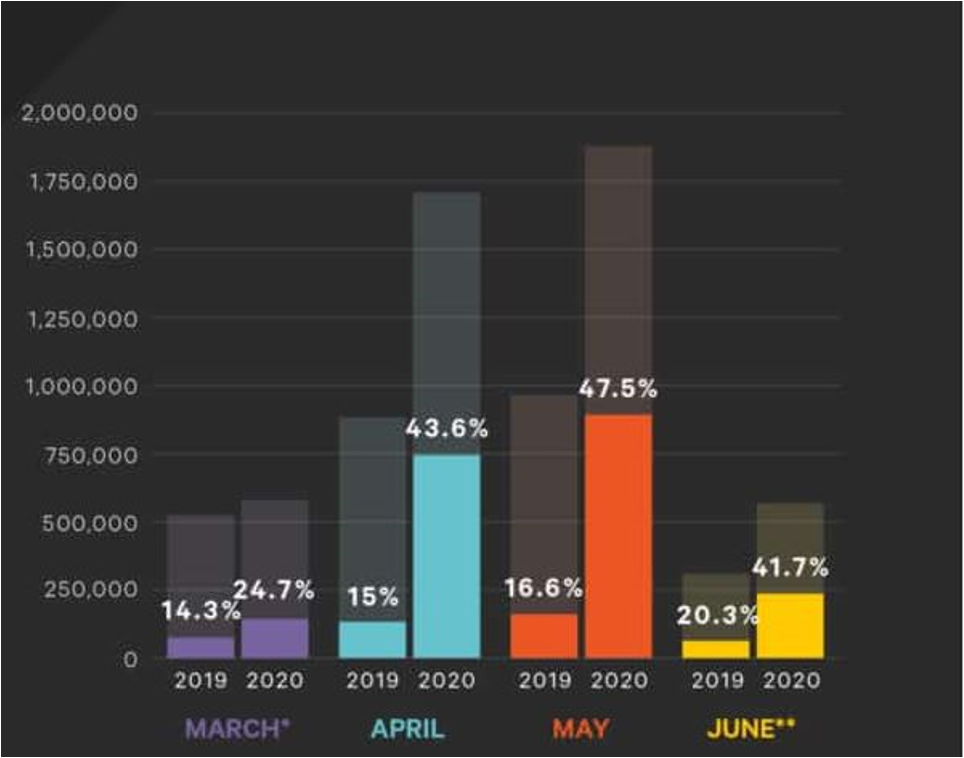
Source: Kibo; Monetate; Certona
*March shows data from March 16, 2020, when the national lockdown was imposed in the United States until the end of the month.
**June’s data reflects activity from June 1, 2020 to June 11, 2020
For the entire period that the above graph depicts (March 16 to June 11), BOPIS orders increased 367%, translating to over 2 million online orders that consumers chose to pick up in stores. Furthermore, in a study conducted by PFSweb, an ecommerce services provider, 63% of shoppers in the U.S. bought items online that they normally purchased in stores. Additionally, PFSweb found that consumers want their orders fast and expect delivery of less than a week for online purchases, which cannot always be accommodated unless one chooses to spend on expedited shipping. That said, we expect the BOPIS trend to continue, even post pandemic, as consumers enjoy the convenience of getting a same-day pickup while not having to spend a minimum amount to receive free shipping or additional money for expedited shipping.
What does this mean for traditional brick-and-mortar stores? We think stores will continue to serve as an essential point of pick-up for the consumer. It also means higher margins for the retailer as shipping costs have squeezed gross margins, with the most expensive portion of the e-commerce transaction being the last mile of delivery. As retailers compete for online sales, most have lowered the minimum amount needed to spend to reach free shipping. This has translated to a reduction in the gross margin through the years. Below I highlight the gross margin trend for a handful of retailers, which largely shows a declining trend through the years as online purchases have increased. To underscore, both Dollar General (DG) and Ross Stores (ROST) currently don’t have an online offering and have been slowly showing a positive trend in the gross margin pre-pandemic. Home Depot (HD) has a loyal following of DIY customers and contractors that will use the store footprint to pick up necessary items that are needed for the day’s project versus waiting for delivery.
Exhibit 7: Retail gross margin trends (2011-LTM 2020)
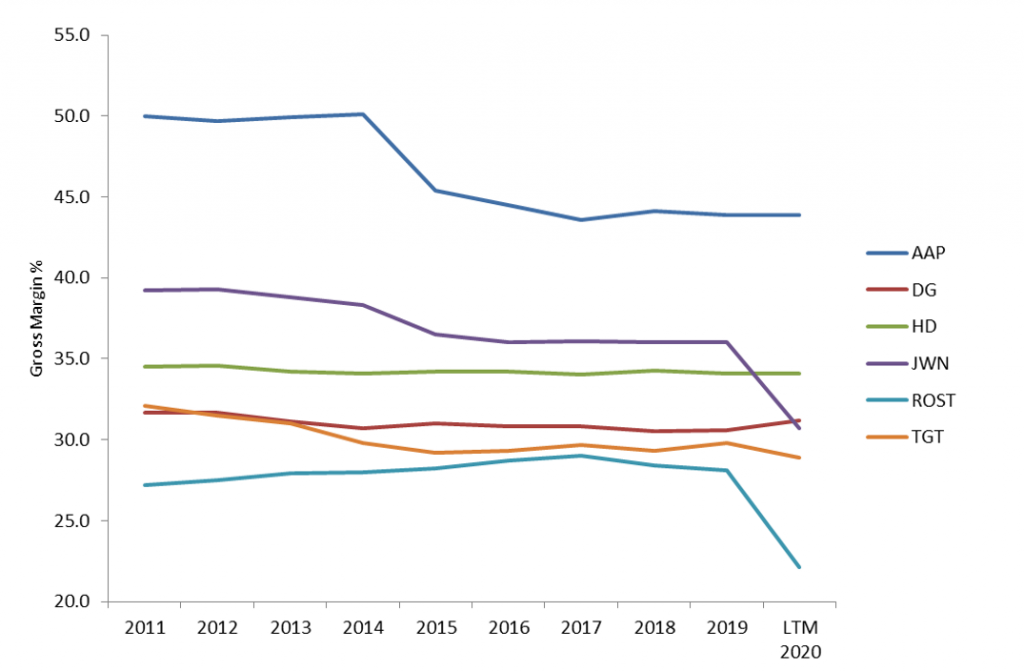
Source: Company Reports; Bloomberg; APS
Additionally, as mentioned above, with the last mile of delivery being the most expensive portion of an e-commerce transaction, most retailers have found that it is cheaper (and usually faster) to send multiple packages to fulfill an online order from a few stores rather than one package from a warehouse that is much further away. Thus, brick and mortar stores act as “mini warehouses” for the retailer. This trend has forced retailers to invest in technology that tracks in store inventory for online fulfillment purposes and helps to reduce the amount of excess inventory that needs to be discounted in order to clear at season end. Warehouses may serve little purpose for a retailer on a go forward basis, with the store network replacing them. Furthermore, when it comes to returns, more customers are choosing the buy online return in store (BORIS) option in order to expedite the credit to their account or worry about return packages not getting delivered within the return window. We continue to see value in the Best Buy (BBY) credit as we believe management will continue to maintain a very conservative balance sheet while benefitting from the BOPIS trend. We also feel that pent up bargain hunting demand with benefit the off-price retailers as they have seen a sizeable increase in traffic since stores have reopened. That said, we believe Ross Stores (ROST) offers the most value relative to its peer TJX Cos Inc. (TJX).
Reports of REITs’ demise grossly exaggerated
The REIT sector was among the hardest hit in the initial throws of the pandemic selloff in late February/early March. While spreads have come back considerably with the recovery in broader credit markets, year-to-date Excess Return for REITs sits at -2.59% as of this month, with +41 bp of aggregate net OAS widening for the sector. That compares with a -1.95% return on +30 bp of aggregate OAS widening for the entire IG Index. The continuing global lockdowns pose obvious challenges for the industry, threatening both near-term and longer-term performance, and accelerating existing negative trends of deterioration in key industries, such as Retail and Office. While we acknowledge these implications, IG issuers in the sector have demonstrated greater resilience than initially presumed by markets, and largely appear well positioned to navigate the challenging months ahead. Key credit and operating metrics have held in better than expected, while the issuers themselves were wisely among the more active segments in bringing new debt deals over the previous six months. This has enabled REIT management teams to take advantage of demand in debt markets for higher yielding paper, and term out their debt structures to enhance their liquidity profiles. IG and crossover REITs have brought over 50 new deals since the third week of March (when Fed credit programs were initiated), totaling more than $31 billion in new issue volume. As a result, the sector has been able to preserve and/or pay down outstanding amounts on companies’ credit facilities, helping shore up emergency sources of liquidity for future use.
We are initiating an overweight view for the REIT sector for the first half of 2021, with an emphasis on selective risk-taking among single tenant, retail and office REITs. While we do not believe investors should be broadly chasing the highest yielding credits in the segment, we think a more balanced approach can help maximize risk compensation through proper credit selection.
The Retail segment has seen the most rapid falloff in average occupancy since the start of the pandemic. Some of the more noteworthy drops in that cohort come from names such as SPG, SKT and FRT. Demonstrating more stability are the Single Tenant REITs; in particular, the higher quality names O, NNN and VER have seen very minimal drop-off since the beginning of the year. Industrial REITs have demonstrated the most resistance to negative occupancy trends, although this segment traditionally does not see an impact until later in the cycle. Office, Apartment and Healthcare all trended similarly throughout the second and third quarter.
Exhibits 8 and 9: Occupancy (%) by sector
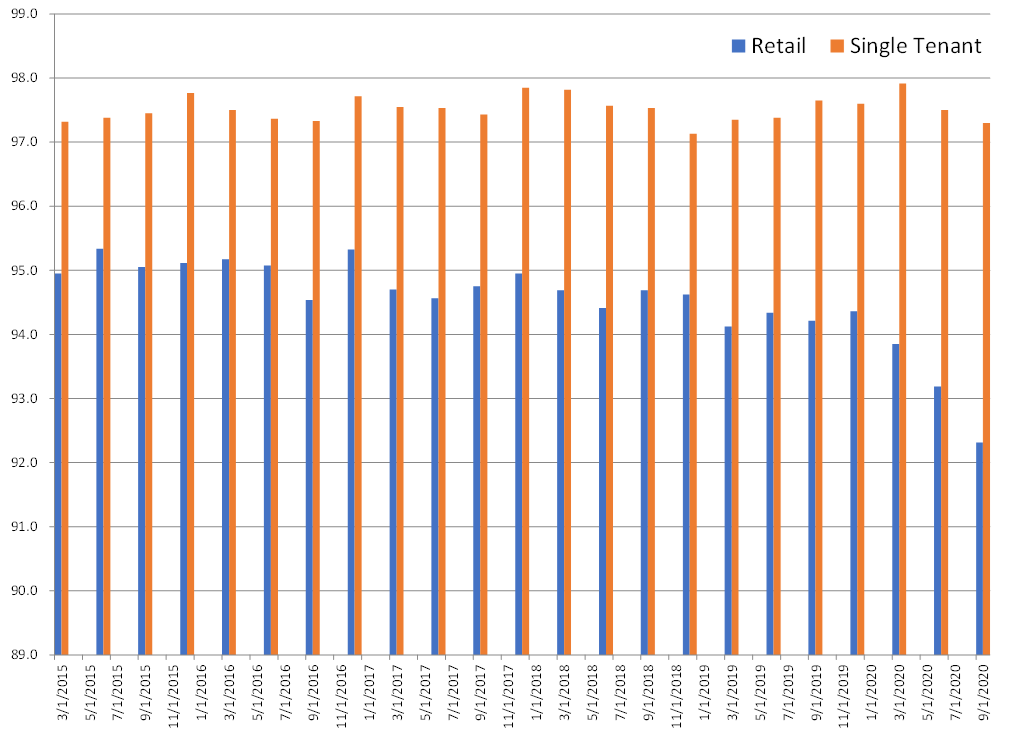
Source: Amherst Pierpont, Bloomberg LP, Company Filings
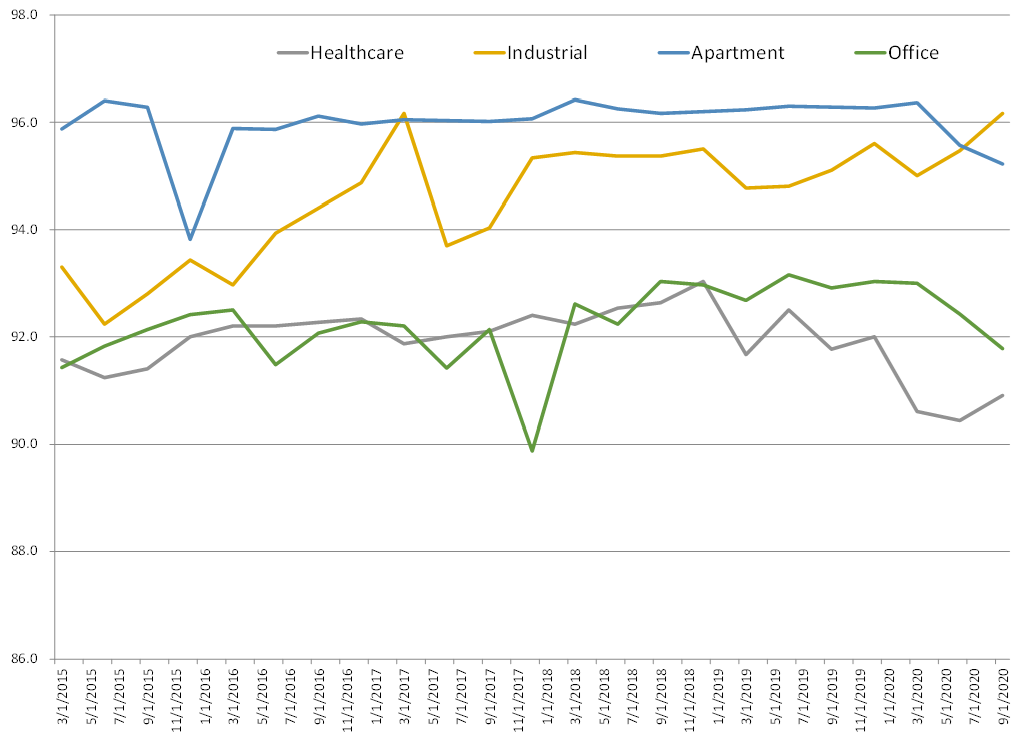
Source: Amherst Pierpont, Bloomberg LP, Company Filings
More important than occupancy at this phase in the cycle has been the emphasis on (cash) rent collection trends. While the REITs have not traditionally reported these statistics (at least not in a format that is readily available historically), they have been making enhanced disclosures over the past two quarters in their quarterly earnings reports. After seeing initial dips in the second quarter, rent collections recovered markedly in the third quarter with parts of the country reopening, and are demonstrating greater stability in more recent monthly disclosures. Nevertheless, with the looming threat of new lockdowns, late fourth quarter and early first quarter months could see a more mixed performance in collections than what was being reported in September and October. As a proxy for rent collections, Exhibit 10 below demonstrates the increase in accounts receivable, which captures the rise in deferrals year-to-date.
Exhibit 10: Accounts receivable by sector: retail, single tenant, healthcare, office ($Million)
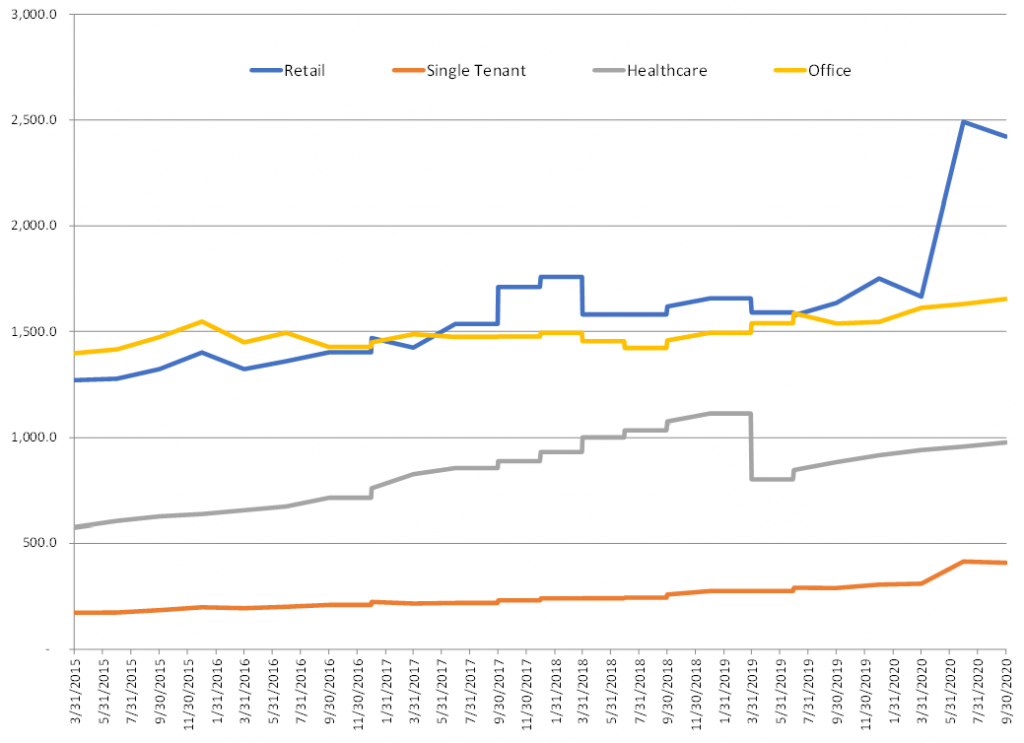
Source: Amherst Pierpont, Bloomberg LP, Company Filings
Both net operating income (NOI) and same-store NOI growth (YoY%) stabilized in the third quarter for Retail and Single-Tenant REITs.
Exhibit 11: Net operating income ($Million) and same-store NOI growth (%) for retail and single tenant
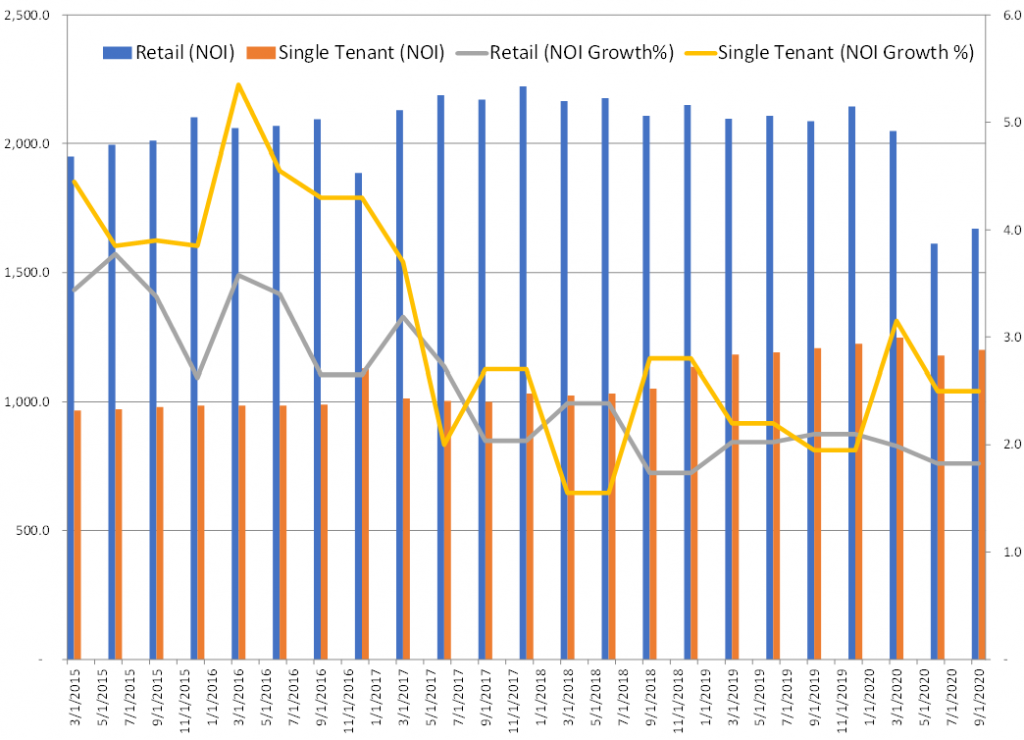
Source: Amherst Pierpont, Bloomberg LP, Company Filings
We believe the rise in leverage will stabilize with improved cash flows for the broader REIT sector in 2021, particularly as we approach the second half when we anticipate that rent collections will begin to see a return to more normal historic levels. While the near-term is likely to be choppy, most IG balance sheets appear well-positioned to weather the storm, with liquidity resources available for emergency funding.
Exhibit 12: Net leverage by sector : average net debt-to-EBITDA (X)
Source: Amherst Pierpont, Bloomberg LP, Company Filings
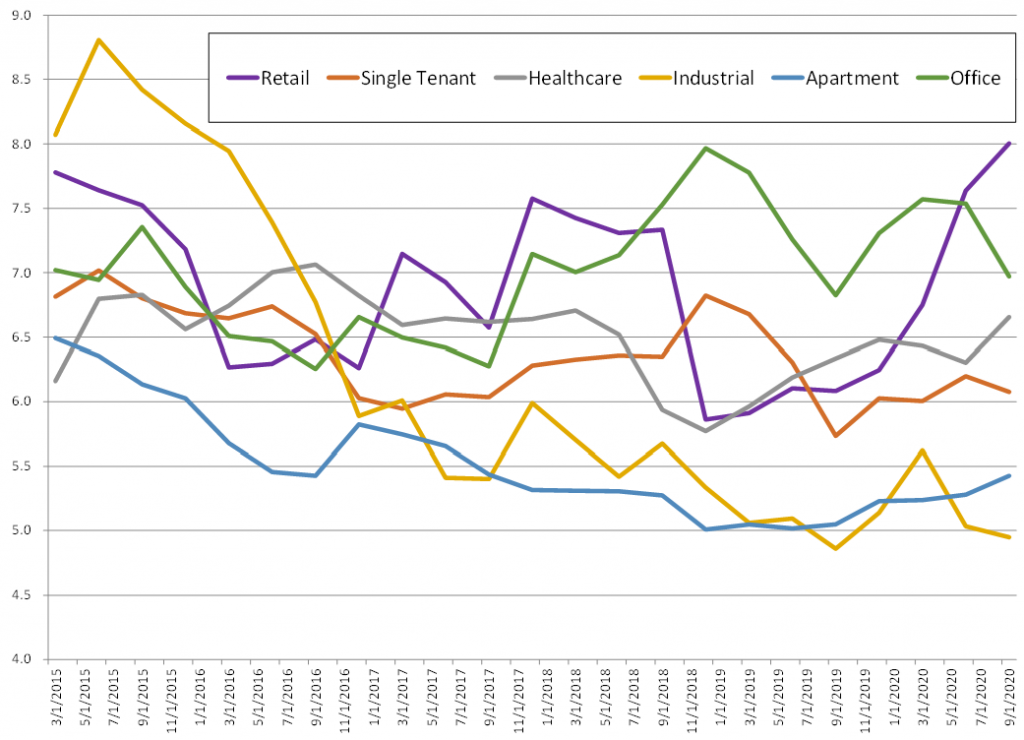
Exhibit 13: Retail and single tenant REITs G-spreads
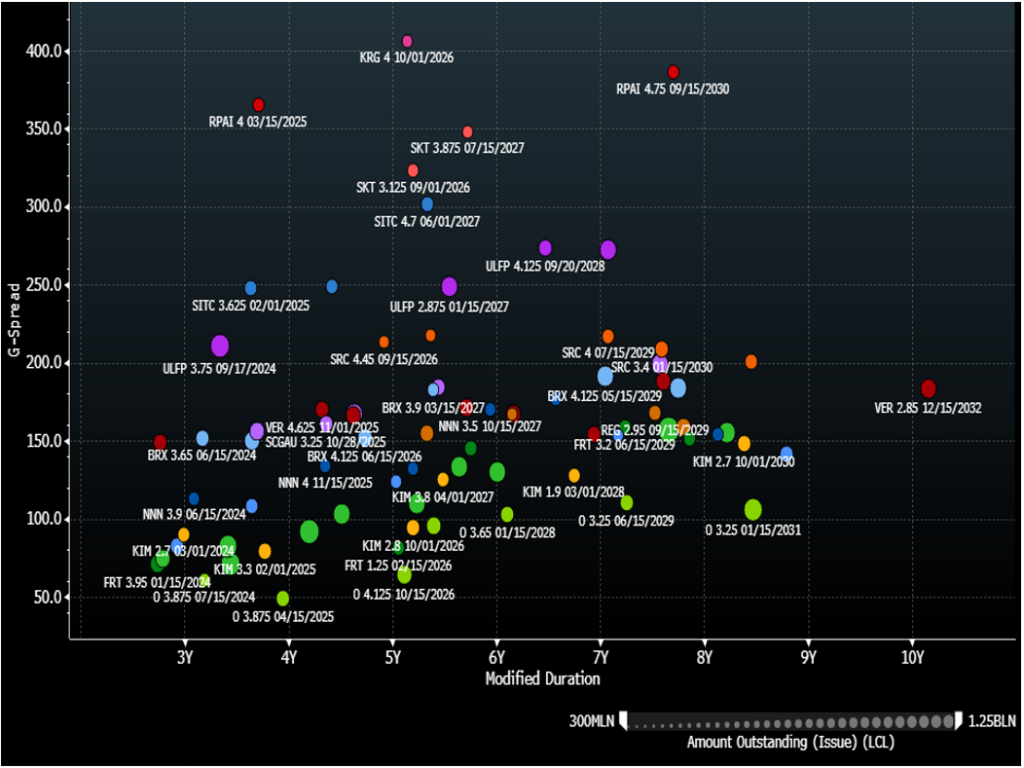
Source: Amherst Pierpont, Bloomberg/TRACE – BVAL G-spreads
Top picks in Retail/Single-Tenant:
Brixmor Property Group (BRX: Baa3/BBB-/BBB-) is the second largest open-air shopping center REIT in the country. Most of their centers are neighborhood, in very good geographic locations (NY, Philly, Houston, Dallas, Chicago, LA, Tampa, Cincy, Miami). The company has a well-diversified tenant base, with largely grocery and discount retail anchored shopping centers. 75% of their retail format is defined as Community/Neighborhood, with an additional 11% grocery-anchored regional centers. There are undoubtedly tenants at greater risk from an extended shutdown of the US economy, such as LA Fitness, Bed Bath and Beyond, etc; but this is consistent throughout the industry. BRX has a solid liquidity profile with just under $600 million in cash on the balance sheet as of 3Q20, plus an additional $1.2 in available credit facilities through 2023 after paying it down earlier this year. The Company also paid down a portion of their next debt maturity, which is not until 2022 with $567 million in senior debt coming due. We advocate positioning in 10-year bonds, which are indicated in a +190-180 context.
VEREIT (VER: Baa3/BBB-) – We see good risk compensation relative to some of their moderately stronger peers, such as O and NNN. As a single tenant REIT, VER does have exposure to some of the riskier tenants in retail/restaurants; but overall, their portfolio is high quality and well diversified by tenant, industry and geographically. The Company has made big improvements to their liquidity profile and have resolved the issues caused by the previous management team. VER currently has over $200 million in cash on the balance sheet, plus their entire $2 billion credit facility available through 2022. Management tapped the bond market twice this year, addressing several needs including paying down the credit facility, and prefunding a portion of the 2020 debt maturity (just $244 million remaining). Their next debt maturity is not until 2024, plus a term loan due in 2023 ($900 million). VER 2029s appear attractive currently indicated at about +185-190 to the curve.
Exhibit 14: Office REITs G-spreads
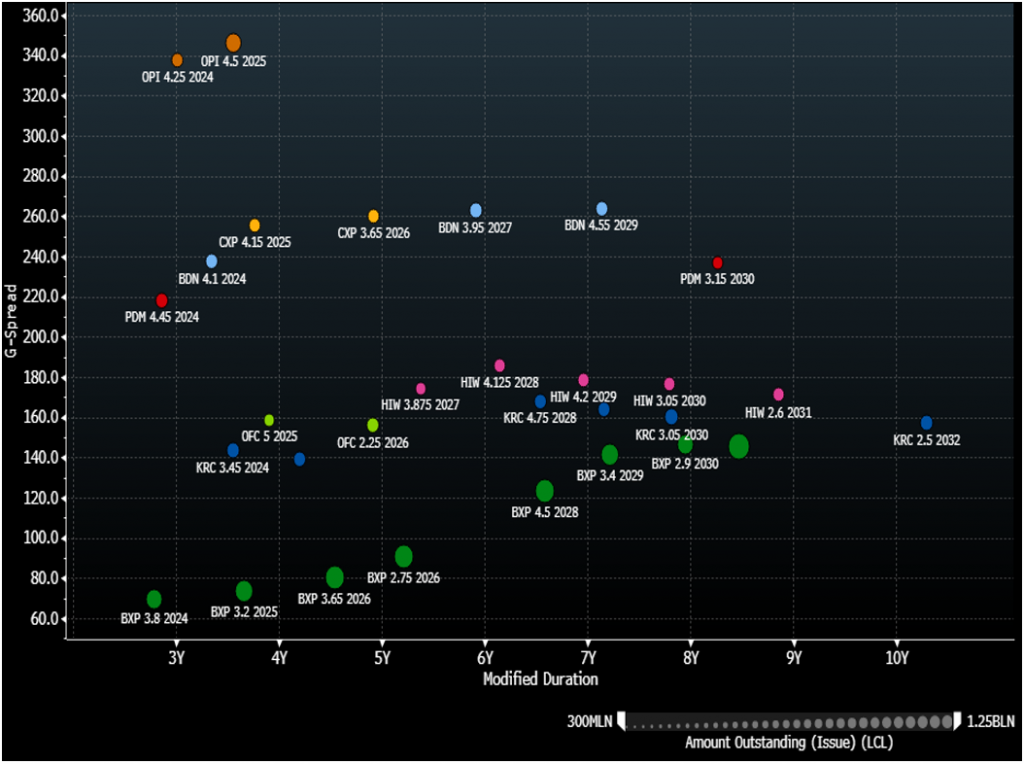
Source: Amherst Pierpont, Bloomberg/TRACE – BVAL G-spreads
Top picks in office:
Corporate Office Properties Trust (OFC: Baa3/BBB-) has somewhat weaker credit metrics relative to BBB/BBB- Office REIT peers; however, it is unique in its position of largely servicing US government defense agencies and contractors. This characteristic likely makes it significantly more resistant to longer term impacts of Covid-19, as well as work-from-home trends that could have indefinite effects on the broader industry. OFC’s liquidity position is stronger after using the proceeds of its recent 5-year debt launch to fund the tender offer for its 2021 maturity debt. They do not have a lot of cash, but have $743 million available under their credit facility through 2023 – the year of their next debt obligation. OFC also has a term loan ($400 million) due in 2022. OFC intermediate paper offers good value to BBB Office REIT comps, trading roughly +160 to the curve.
Piedmont Office Realty Trust (PDM: Baa2/BBB) trades at a considerably wide gap to similar-rated comps, such as HIW (Baa2/BBB) and KRC (Baa2/BBB). This is due in part to the fact that their geographic footprint is considered a little less attractive than the other two, with less exposure to “gateway” areas. They are focused in growing their core sunbelt exposures in Atlanta, Orlando and Dallas, but exposures to more mature markets of NY, Boston and DC (just under 40%) – while traditionally viewed as positives – are probably being treated more negatively with the risk of urban flight. PDM also made some fairly significant acquisitions just prior to the Covid-19 crisis, and will have those properties coming online at less than opportune time. They are otherwise pretty-well diversified by industry and tenant. Another area that has been of greater concern for PDM versus peers has been their liquidity profile, but the recent 10-year launch in August helped improve that by paying down 2020 and 2025 term loans. They now have just $300 million in loans outstanding next year, with the entire $500 million of their 2022 credit facility available. PDM may be in line for another debt launch in the near-term, but the +225-230 to the curve available on PDM 10-years is attractive relative to peers.
Technology could outperform again
Year-to-date through October, investment grade Technology has returned 8.74%, outperforming the index by 172 bp. We note that Technology is the sixth best performing sector in the index year-to-date behind Other Utilities (10.76%); Natural Gas (10.26%); Insurance (8.92%); Electric (8.56%) and Consumer Non-Cyclical (8.4%). Many of the high-quality technology names including Microsoft (MSFT), Apple (AAPL) and Alphabet (GOOGL) remain in very large net cash positions. That said, even if management teams were to pursue elevated levels of shareholder remuneration, ratings are likely to remain stable given the sizeable cash positions coupled with very strong free cash flow generation. For example, AAPL’s aggressive capital allocation has returned $497billion to shareholders since 2012. Despite the level of return, AAPL still remains in a net cash position of $79billion and is estimated to generate nearly $75billion of free cash flow this year. The excessively liquid balance sheets enjoyed by the ‘AAA’ and ‘AA’ technology credits, has created a significant spread dislocation between the higher quality names and the higher beta ‘BBB’ credits, particularly in the belly of the curve, as highlighted in Exhibit 15.
Exhibit 15: Technology curve (AAA-BBB)
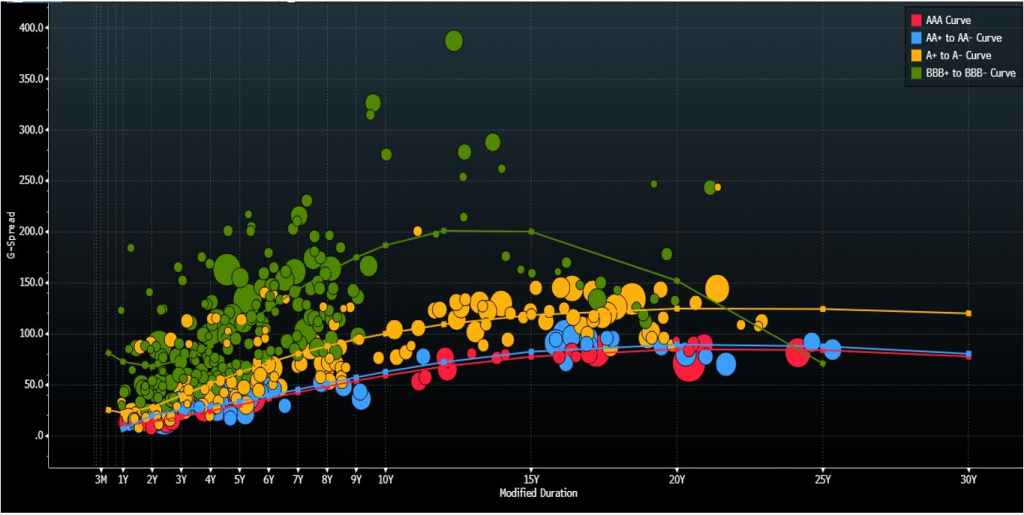
Source: Bloomberg TRACE, Amherst Pierpont
We think outperformance of the technology sector could be driven by the BBB credits as the potential to be “fallen angels” dissipates with further debt reduction. Both Dell Technologies (DELL) and Broadcom Inc (AVGO) have committed to reducing debt, while making significant improvements to the balance sheet this year. DELL has already reduced core debt by $2.3billion year-to-date and has committed to reducing it by approximately $5.5billion in fiscal 2021. We note that since the EMC acquisition closed four years ago, DELL has reduced core debt by $15billion. Should the company look to sell or spin VMWare next year, that could provide DELL with sizeable proceeds for further debt reduction. Additionally, AVGO improved its weighted average maturity to roughly 6 years (from just over 4) while reducing its weighted average interest expense to approximately 3%. Debt reduction in 2020 is expected to be just shy of $5billion. AVGO’s share buybacks remains on hold, which supports further debt reduction in 2021, particularly as they are expected to generate over $10billion of free cash next year.
IG aircraft lessors poised for continued outperformance in 1H20
The Aircraft Lessors segment was provided two key developments in the past two weeks. The first being the announcements of two recent successes in vaccine testing, which bodes well for the recovery in airline travel over the near-to-intermediate term. And the second being the FAA’s announcement to resume flights of Boeing’s 737 Max aircraft, removing a critical overhang for many aircraft backlogs in the industry. While neither serves as an immediate panacea for the challenges confronting the industry, both help to alleviate the concerns that still have credit spreads trading wide of recent historic norms.
Aircraft leasing credits were among the hardest hit in the IG Index during the pandemic sell-off. Subsequently, they were among the more reluctant to return in the initial phases of the recovery as credit markets improved. Since then, however, Aircraft Lessors have been among the best performing credits in the entire Index. From the end of May, the Finance Companies sector (a large majority of which is comprised of the Aircraft Lessors) has generated a +14.4% Excess Return and +13.9% Total Return, with aggregate OAS spreads tightening a staggering -266 bp over that time period. That compares with Excess and Total Return of 6.2% and 5.1%, respectively, on OAS tightening of -77 bp for the IG Index.
We are initiating an Overweight view for the Aircraft Lessors segment (Finance Companies sector within the Bloomberg Barclays IG Index) for the first half of 2021. Our expectation is that airline travel will recover faster than the market is currently anticipating, bolstering the outlook for the companies providing aircraft financing to the carriers. We believe investors can maximize returns by targeting some of the higher yielding credits within the industry. While the immediate term performance of bonds may be choppy on COVID-19 related headline volatility, we would target these dislocations as opportunity to add exposure to this particular segment.
Exhibit 16: Aircraft lessors 3- to 10-year G-spreads
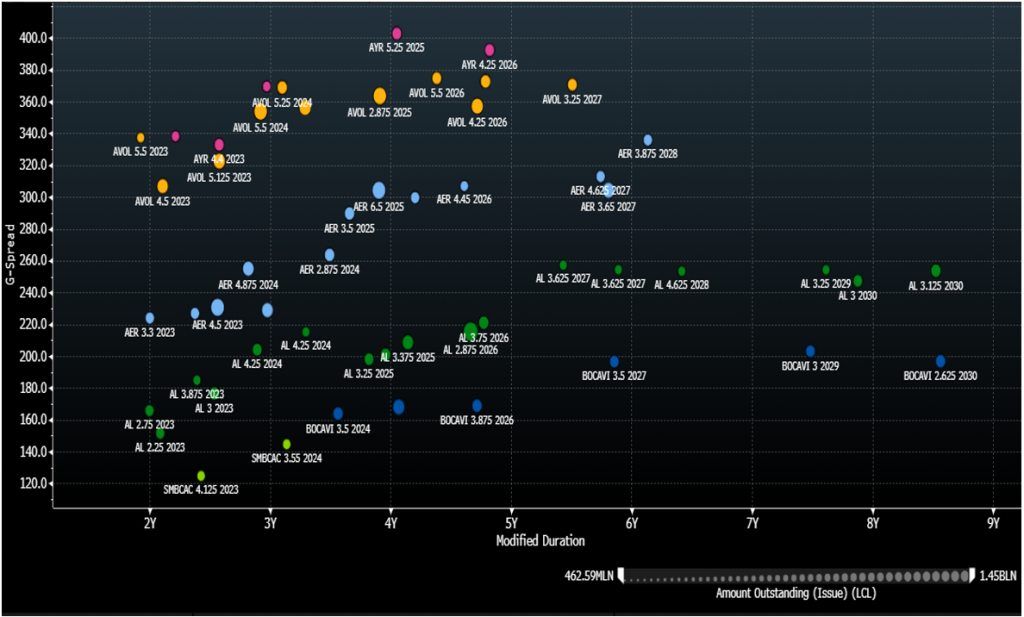
Source: Amherst Pierpont, Bloomberg/TRACE – BVAL G-spreads
Top picks in aircraft lessors:
Aircastle Ltd (AYR: Baa3/BBB-/BBB-) shorter maturity (2023-2024) obligations appear attractive. AYR is unique among peers in that they strictly acquire mid-life aircraft. Average age of their aircraft portfolio is about 9 years, which compares with an industry leading level of about 4 at Air Lease and low 6s at names like AER. The fleet consists of 283 aircraft, the large majority of which are unencumbered. 90% of the aircraft are currently classified as narrow body. AYR services 80 separate airline customers in 44 nations., and the portfolio is well diversified geographically. AYR’s credit profile improved in recent months with the acquisition by minority stakeholder Marubeni in a joint venture with Mizuho. The new foreign ownership provides considerable implicit financial support that was not there previously. Management reports that they have over $2 billion in available liquidity. AYR has $500 million in senior debt maturing in each 2021 and 2022, ahead of the $1.15 billion due in the bond’s maturity year of 2023. The Company has $319 million in cash on the balance sheet as of 2Q20, plus $1.08 billion in available capacity on its credit facilities through 2022. Cash flow from operations is typically over $500 million annually.
Avolon Holdings Ltd (Baa3/BBB-/BBB-) intermediate paper (2025-2027) appears attractively priced for outsized returns in the 1H201. The Company actually has one of the stronger aircraft portfolios in the industry, second only to AL in our opinion. It is the second largest globally with 486 owned aircraft and commitments in place for 277 additional as of 2Q20. AVOL boasts a very young fleet with an average age of 5.2 – second only to AL among the major IG lessors. The aircraft are mostly narrow body, with concentrations among popular models. AVOL trades wide to the sector largely due to its foreign ownership. Avolon was purchased by China-based Bohai Leasing Co Ltd in 2016 for $2.5 billion. Bohai is 51% majority owned by Hong Kong-based and privately held HNA Group. Japanese commercial finance conglomerate ORIX Corp (ORIX: A3/A-/A-) owns a 30% equity stake with high voting rights in AVOL. The investment came with a Shareholder Agreement with Bohai that stipulates among other things that AVOL be managed as an investment grade company, and that dividends cannot exceed 50% of net income. AVOL made two recent trips to the public debt markets in September and November of this year, which helped improve its liquidity profile, as it will pay down a portion of near-term obligations via a recently launched tender offer. They have about $3.8 billion remaining on their two credit facilities through 2024.