


Uncategorized
Extracting upside to elevated prepayments in RPLs
Chris Helwig | January 15, 2021
This document is intended for institutional investors and is not subject to all of the independence and disclosure standards applicable to debt research reports prepared for retail investors.
The structure of seasoned RPL transactions may play well this year in a market where spread tightening should be only a fraction of last year’s move. The return of principal sequentially to the most senior outstanding RPL class means the structure steadily deleverages, unlike pro-rata classes in non-QM structures or shifting interest classes in prime jumbo. But recent prepayment and delinquency performance across seasoned RPLs has been inconsistent. Investors should focus on attributes like relative amounts of forbearance and the population of loans with long current-pay strings to maximize potential deleveraging and spread tightening.
During the spring of last year delinquency rates in seasoned RPLs spiked and prepayment rates slowed as the pandemic affected borrowers across all sectors of mortgage credit. Borrower performance subsequently improved fairly materially and prepayment rates rose for the majority of the rest of the year. However, borrower performance in the sector took a downturn in the sector in December as prepayment rates broadly slowed and delinquency rates ticked up modestly (Exhibit 1). The change in the trajectory of both prepayment rates and credit performance last month illustrates the need for prudent asset selection in the sector as this downturn was not evident across all profiles.
Exhibit 1: Prepays slow and DQs rise in RPL collateral in December
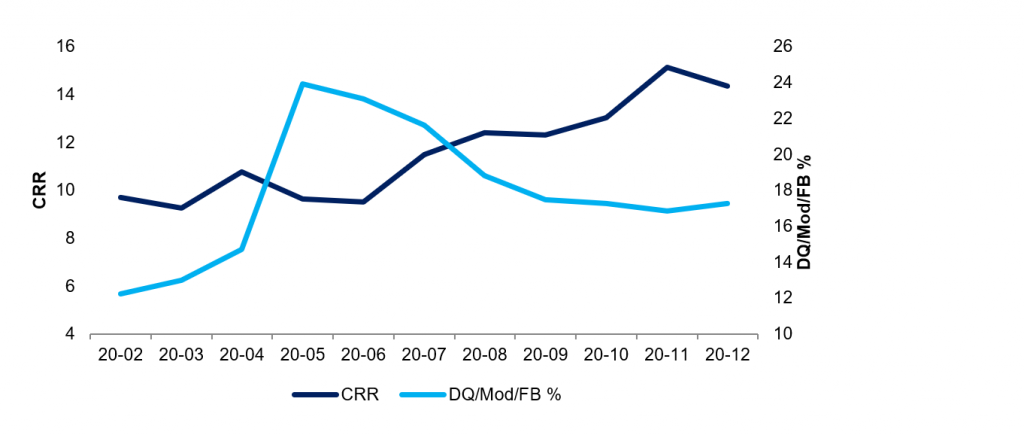
Source: CoreLogic, Amherst Pierpont Securities
Focusing the analysis on only major RPL issuers shows most are by and large performing better than the broader cohort. Focusing on four major shelves; BOFMT, MCMLT, NRZT and TPMT, shows delinquency rates in December for across these issuers was just under 10%, roughly seven points lower than that of the broader cohort (Exhibit 2). Overall delinquency rates nevertheless appear to be increasing at a faster pace as they have increased roughly 200 bp since September. Looking at shelf level performance, it appears the rise in delinquency rates has come largely from the NRZT shelf, where delinquency rates are not only substantially higher than those of other shelves but have risen in a more meaningful way in recent months.
Exhibit 2: Stacking up shelf level delinquencies in seasoned RPLs
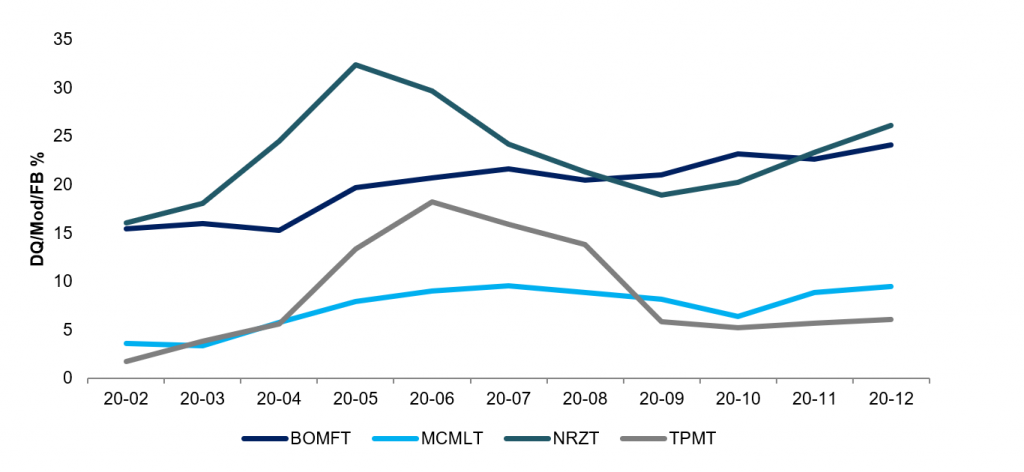
Source: CoreLogic, Amherst Pierpont Securities Note: Analysis exclusive to 2017 and later vintage transactions exclusive of any non-performing loan securitizations by the sponsor
One likely reason for the divergence in performance across shelves is that the NRZT shelf often sources collateral by calling legacy structures to get the underlying loans. This is evident from NRZT delinquency rates substantially higher than the TPMT and MCMLT shelves prior to the delinquency surge in the spring. It is important to differentiate sequential-pay deals where the collateral is generally sourced from the GSEs or bank portfolios versus shifting interest deals where the collateral is sourced from legacy trusts. Legacy collateral continues to show elevated levels of new delinquencies particularly in the subprime and Option ARM cohorts.
Forbearance matters
Another consideration when it comes to seasoned RPL transactions is the amount of forbearance securitized, which will vary from trust to trust. Somewhat different from most legacy deals, outstanding principal forbearance on modified loans is securitized in the balance of RPL trusts. Loans with forbearance attached to them are by definition more highly modified, assuming a traditional HAMP modification waterfall where the borrower’s rate and term has already been modified prior to the extension of a balance modification, than those where the borrower is modified without the extension of a forbearance modification. Forborne principal also reduces the WAC on the borrower’s loan as the effective WAC is the weighted average of the note rate on the performing balance of the loan and zero on the non-performing forbearance. As such, pools with higher amounts of securitized forbearance may not only be collateralized by borrowers with weaker credits but also those with less incentive to refinance their loans, potentially leading to both higher delinquency rates and slower prepayments.
Looking across the universe of seasoned RPLs, deals issued in 2018 and early 2019 have by far the largest concentrations of securitized forbearance. Comparing trusts with large amounts of securitized forbearance to those without show a sizable difference in their average 6-month prepayment rate as trusts with low amounts of forbearance prepay roughly twice as fast as those with larger concentrations However, it’s important to weigh other collateral considerations when thinking about prepayment rates. For example, hybrid ARM and second lien collateral has exhibited faster prepayment rates than fixed-rate loans historically and investors should be cognizant of these attributes when thinking about upside to faster prepayments and subsequent deleveraging. (Exhibit 3)
Exhibit 3: Large amounts of securitized forbearance can weigh on prepayments
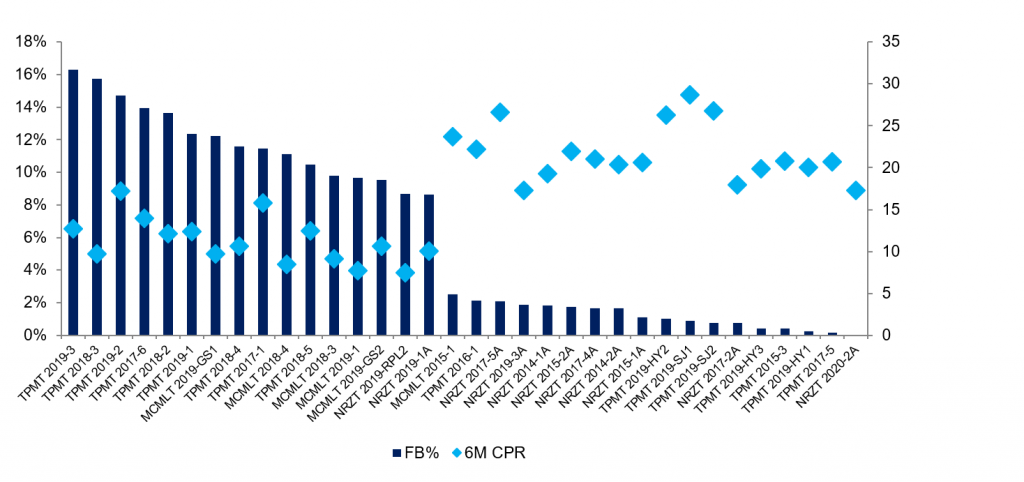
Source: CoreLogic, Intex, Amherst Pierpont Securities
One additional wrinkle when thinking about forbearance in RPL deals is not only the amount of forbearance securitized at issuance but additional forbearance that has subsequently accrued to these trusts. In recent months, as delinquency rates rose, servicers have, in some cases, capitalized and deferred the borrowers’ arrearages generating a loss to the trust and reducing credit enhancement. This ‘new’ forbearance may not flow back to the trust in the same manner, or at the same rate of recovery as securitized forbearance since it has been recently granted and may take longer to recoup than existing forbearance.
Payment velocity matters, too
One additional consideration when thinking about upside to deleveraging through prepayments is the population of loans that have shown strong payment strings over a longer observation period. Larger populations of loans that have not missed a payment in two years obviously should be consistent with lower delinquency rates. And there are other considerations to take into account such as WAC and effective WAC net of forbearance when thinking about leverage to pools that exhibit strong payment velocity. Investors also need to be aware of potential differences in the reporting of borrowers pay strings across different shelves and issuers. It nevertheless appears that deals with larger concentrations of borrowers with better payment velocity should prepay faster than those without. Looking across the same universe of trusts, deals with higher concentrations of loans that were clean pay for two years exhibited faster prepayment rates than those without. Once again, faster paying deals include hybrid ARM and second lien collateral but it appears one driver of faster speeds in these deals are the outsized populations of loans with strong payment histories (Exhibit 4).
Exhibit 4: Larger populations of 24-month current pay loans drive faster speeds
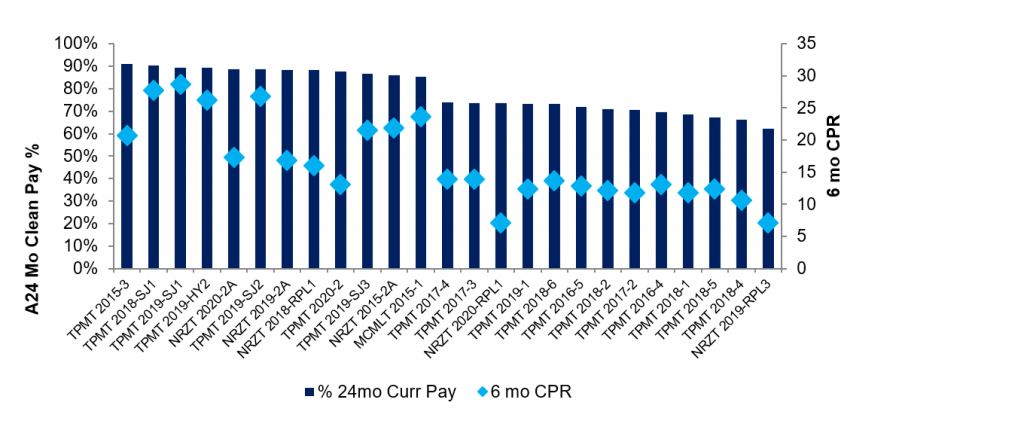
Source: CoreLogic, Intex, the issuers, Amherst Pierpont Securities