


The Big Idea
Notes on bank deposits and the bid for duration
Steven Abrahams | February 26, 2021
This document is intended for institutional investors and is not subject to all of the independence and disclosure standards applicable to debt research reports prepared for retail investors.
The tsunami of cash heading toward bank balance sheets again this year creates a complicated challenge for the team managing assets and liabilities. Banks reinvested the majority of last years’ tsunami into short assets, signaling concern that new deposits could leave as quickly as they arrived. But history suggests a quick exit is unlikely. The weighted average life of excess reserves invested over the last year could be as long as eight years. As that sinks in, the bank bid for duration could increase and balance sheet performance improve.
QE drives bank cash balances
Banks now hold nearly $3.4 trillion in cash assets such as excess reserves at the Fed, fed fund loans and the like. That balance could rise as banks reinvest $2.5 trillion in new cash likely to arrive on the balance sheet this year. Roughly $1.4 trillion in new cash should come from Fed QE at a pace of $120 billion a month with another $1.1 trillion in new cash arriving as the Treasury draws down its own cash balances now held at the Fed. Banks last year invested 55% of marginal new liabilities in cash assets, 20% in MBS, 12% in Treasury debt and the rest in loans and securities. That implies banks this year could bump up cash investment alone by $1.4 trillion.
Bank holdings of cash assets have roughly tracked the course of QE over more than a decade. Most of the cash pumped into the economy by Fed purchases ends up as bank deposits that get reinvested. Banks’ cash assets rose during QE1 (2008-2010), QE2 (2010-2011) and QE3 (2012-2014), declined as the Fed started balance sheet normalization (2017-2019) and jumped again as QE4 started last March (Exhibit 1).
Exhibit 1: Bank cash assets roughly rise and fall with QE balances
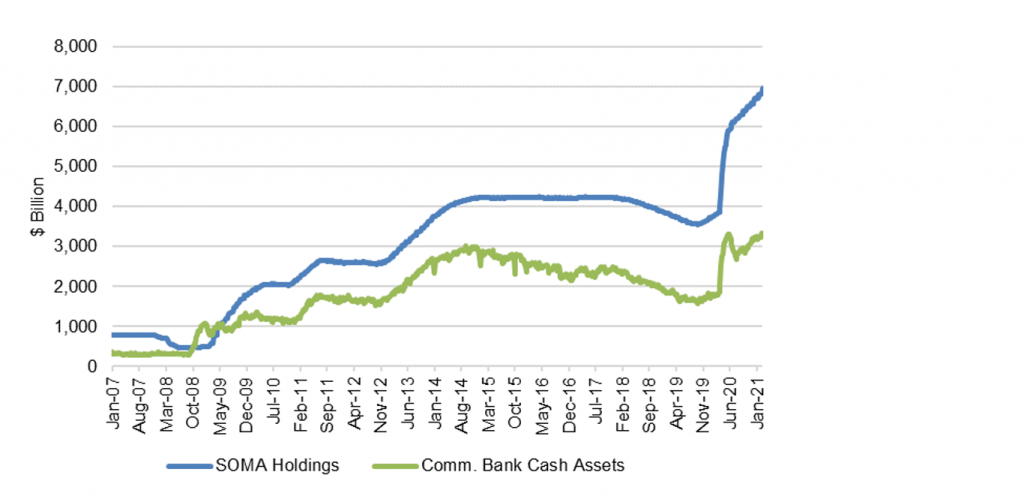
Source: Federal Reserve, Amherst Pierpont Securities
Cash flowing onto bank balances sheet through QE tends to get reinvested disproportionately in cash assets and not simply spread into loans and securities. Cash assets rose from only 3% of total bank assets before 2008 to a higher share with each round of QE, peaking at the end of QE3 at 20% (Exhibit 2). Cash asset share drifted down to 10% at the end of normalization and has rebounded lately to 16%. There is some tradeoff between cash assets and investments in loans and leases, but that likely reflects Fed tendency to launch QE when the economy is weak and normalize when it is stronger. Banks could invest in securities, and securities’ share would rise and fall with QE; it does not.
Exhibit 2: Balance sheet share for cash assets also rises and falls with QE
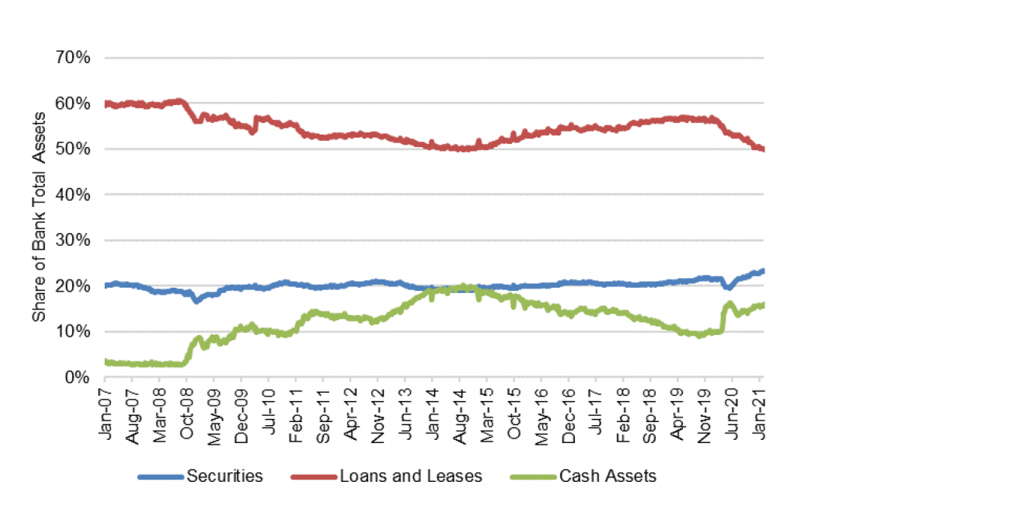
Source: Federal Reserve, Amherst Pierpont Securities
Investments imply banks see QE-derived deposits as overnight liabilities
Heavy investment in cash assets suggests bank asset-liability managers view liabilities derived from QE as very short and encourage or insist on investment in similar assets. Other factors can affect the investment decision including the alternative return from taking risks in loans and securities as well as the regulatory benefits of holding cash assets for liquidity, stress testing and so on. But buying short assets to match short liabilities is likely the major influence. Of course, short assets usually yield less than longer assets. The decision to view QE-derived deposits as virtually overnight comes with significant opportunity cost: namely, the spread between short and long assets.
Past Fed behavior implies QE-derived deposits have much longer average lives
One clear historical feature of deposits generated through QE is that the average life depends on the arc of Fed policy. Unlike deposits shaped by consumer or corporate behavior, aggregate deposits derived from QE respond to the Fed. The deposits legally may be overnight liabilities, and a depositor can withdraw cash and put it in another bank. But if a bank maintains a stable share of deposits, the bank’s deposit base should rise and fall with QE. History suggests the arc of QE falls into distinct and sometimes long phases:
- Full QE. Experience suggests that as QE continues, deposits will rise in parallel. The Fed lately has suggested it will continue QE at its current pace at least through the end of 2021. For excess reserves now on balance sheet, that creates at least a year of average life
- Taper. After the Fed decides to end QE in full, it will likely taper over some reasonable interval. The last time the Fed tapered, it announced on December 18, 2013 and concluded on October 29, 2014. If history repeats, that will add more than 10 months of average life
- Watch and wait. After the Fed finishes tapering, it will almost certainly wait for the long and variable effects of monetary policy to play out. This is probably the most uncertain phase since it depends on how monetary policy interacts with global monetary and fiscal policy as well as organic growth and inflation. After the Fed finished tapering in 2014, it held QE balances steady until October 2017. If history repeats, that will add three years of average life
- Normalize. When conditions warrant drawing down QE balances, the Fed is likely to draw on its past playbook. In October 2017, the Fed began reducing Treasury balances by an incremental $6 billion monthly, raising the amount every three months by $6 billion until it reached a cap of $30 billion in monthly reductions. It began reducing MBS balances by an incremental $4 billion a month, raising the amount every three months by $4 billion until it reached a cap of $20 billion a month. The Fed then let balances fall by $50 billion a month toward some target amount of system reserves. If banks start next January with roughly $4.8 trillion in reserves and the Fed wants to reduce reserves to the $1.7 trillion held before pandemic, it will take a year to reach $50 billion in monthly reductions and another 4.6 years to reach target. That amounts to a weighted average time to normalize of 3.3 years
If the path of QE repeats itself, then the average life of cash assets brought on balance sheet since March 2020 is more than eight years:
Full QE (1.0Y) + Taper (0.8Y) + Watch and wait (3.0Y)
+ Normalize (3.3Y) = 8.1Y
Even the most severe stress testing of these QE intervals suggests the average life of today’s excess reserves is measured in years, not days.
Incentives to extend out of cash assets
Banks have seen net interest income drop significantly in the last year in both loan books and in cash and securities portfolios. Loan demand may pick up this year as the economy rebounds, but recently bank earnings reports included a chorus of managers with low expectations. After netting out expected loan growth in 2021, banks and their asset-liability managers still face the choice of investing a tsunami of cash in either cash assets or securities.
The securities market has given bank investment portfolios more to work with this year as a steeper yield curve and wider spreads in MBS create potential book yields well above most levels of last year. The 10-year yield last August dropped to 0.52% but now stands at 1.41%. The par 30-year MBS coupon hit a low last August of 1.20% but in February has averaged 1.60%, with a local peak in recent sessions above 2.00%. Longer MBS assets carry significantly higher book yields.
It is likely that banks will start thinking about the course of QE and the likely average life of cash now on the balance sheet and landing on the balance sheet over the next year. Excess reserves are still likely to earn 10 bp at the Fed, and the opportunity cost of staying in cash should remain high or increase. Asset-liability managers may worry that buying longer assets now could expose the bank to falling net interest income over the life of the asset as the Fed eventually raises rates. But banks can hedge this risk by paying the fixed leg on an OIS swap and capturing most of the spread available today between cash and longer investments.
The substantial average life of 2020 and 2021 deposits, the high opportunity cost of staying in cash this year and the need for earnings should encourage banks to slowly extend investment duration. Last year’s buying behavior already implies strong demand for Treasury debt and MBS. The bank extension out of cash should magnify that demand. The bank bid consequently should have some impact on intermediate and longer Treasury yields and drive MBS spreads back to some of the tighter levels seen earlier this year.
* * *
The view in rates
The 10-year rate for the balance of the year should range between 1.50% and 1.95%, which was exactly its range in the six months before pandemic. Equilibrium is probably at 2.50%, but that should take much more evidence of sustainable growth and inflation. The Biden administration’s $1.9 trillion stimulus package looks likely to pass through reconciliation, and the surge of cash and federal spending should continue to push growth and concern about inflation. But much of that is priced in.
The Treasury yield curve has finished its most recent session with 2s10s at 128 bp, within striking distance of the highest in five years. It should continue to steepen. The 5s30s curve has finished its latest session at 142 bp, down from its recent peak. As 30-year rates approach 2.50%, they should have less room to move up, and the 5s30 curve should start to flatten. Inflation expectations measured by the spread between 10-year notes and TIPS have moved sideways over the last week to 215 bp. Real rates have moved up sharply as nominal rates rise. Volatility has jumped back up to levels last seen around the elections in November, but it is still at the average of the last five years.
A heavy supply of cash continues to reduce repo rates, Treasury bill yields and LIBOR. Yields on 2-year notes have moved a few basis points higher in the last week despite much larger moves up at longer maturities.
The view in spreads
Spreads in credit should continue to tighten slightly despite being near or at historic tights. In MBS, rising rates have widened spreads, but bank demand should bring spreads back to earlier and tighter levels. The Treasury cash tsunami should keep short yields low and spreads on highest quality assets tight. QE absorbs MBS, the relatively riskless spread asset, at least regarding credit. Fiscal stimulus, pandemic recovery and Fed policy should also keep spreads steadily tighter through 2021. Weaker credits should outperform stronger credits, with high yield topping investment grade debt and both topping safe assets such as agency MBS and Treasury debt. Consumer credit should outperform corporate credit.
The view in credit
Consumers in aggregate are coming out of 2020 with a $5 trillion gain in net worth. Aggregate savings are up, home values are up and investment portfolios are up. Consumers have not added much debt. Although there is an underlying distribution of haves and have nots, the aggregate consumer balance sheet is strong. Corporate balance sheets have taken on substantial amounts of debt and will need earnings to rebound for either debt-to-EBITDA or EBITDA-to-interest-expense to drop back to better levels. Credit should improve as warmer weather and better vaccine distribution allows more opening of economic activity. Distribution and vaccine uptake through the end of 2021 should put a floor on fundamental risk with businesses and households most affected by pandemic—personal services, restaurants, leisure and entertainment, travel and hotels—bouncing back the most.