


By the Numbers
MBS: Supply, speeds and spreads in investor PLS
Chris Helwig | May 14, 2021
This document is intended for institutional investors and is not subject to all of the independence and disclosure standards applicable to debt research reports prepared for retail investors.
The MBS market is anticipating heavy supply of private deals backed by investor loans. The supply technical looks to weigh on spreads in the near term, while a likely dampened prepayment response to shifting interest rates may help anchor spreads to some degree. Some measure of relative value will also likely influence spreads in the sector. Spread buyers in structured products will likely see ‘AAA’ pass-throughs as one of the widest ‘AAA’ assets, while total return players may continue to favor lower coupon agency pass-throughs as special dollar rolls look to continue to enhance returns.
Sizing up supply
The market remains keenly focused on the growing supply overhang in agency-eligible non-owner-occupied loans being generated by caps on future Fannie Mae and Freddie Mac purchases. Non-owner-occupied loans made up 8.94% of Fannie Mae’s total first quarter volumes while Freddie Mac’s non-owner-occupied volumes totaled 7.52%. Amherst Pierpont estimates that non-owner-occupied loan origination above the GSEs’ 7% caps could run between $8 billion and $10 billion a month, supply that would have to be absorbed through whole loan sales to bank or insurance portfolios, REITs, money managers or private-label securitization conduits. And the amount of supply may continue to grow as it was reported late last week that Freddie Mac is considering reducing caps on purchases of non-owner-occupied loans to 5%, although the agency has released no official guidance.
Demand for whole loans could vary substantially. At banks, there’s likely finite capacity to take on the interest rate and credit risk associated with holding longer duration whole loans in held-for-investment portfolios, especially loans originated outside their own retail channels as these loans are likely less sticky on their balance sheets. However, loans backed by single-family investment properties should, at a minimum, be on equal footing with single-family owner-occupied ones in terms of regulatory and risk-based capital and may not carry any incremental risk-based capital usually associated with commercial purpose loans. A limited number of money managers are set up to accommodate whole loans, although they bring substantial capacity. The relative value for asset managers would likely depend on where they can buy these pools relative to RPLs, which are in scarce supply these days. For REITs it would likely come down to how much more they could earn on a levered basis owning loans and financing them relative to more liquid leverage strategies, such as rolling highly leveraged positions in TBA pass-through at special implied financing rates.
Sizing up prepayment protection
Beyond supply, the prepayment behavior of investor loans also drives relative value. The most intuitive data suggests a pair of key differences between investor and owner-occupied borrowers: the effective refi rate available to the borrower, and originators’ ability and incentive to pursue and process the loan.
Investor and owner-occupied loans face material differences in loan level pricing adjustments. LLPAs on investor loans range from 2.125% to 4.125% based the loan’s loan-to-value ratio. Large risk-based pricing adjustments translate to investor pools with higher GWACs and more spread at origination (SATO) than comparable owner-occupied loans originated at the same time. Given this, it can be challenging to normalize refinancing incentive across investor and owner-occupied pools, or create a traditional S-curve that would be able to estimate the response to equal amounts of refinancing incentive across the two cohorts.
One simple means to try to normalize incentive between the two cohorts would be to look at pools of zero WALA investor and owner-occupied loans with comparable loan sizes and observe their prepayment rates as they travel across the same interest rate path. The simplifying assumption is that coupons on both pools will represent the at-the-money rate at the time of origination; both pools should have the same amount of refinancing incentive over time as interest rates change. Looking at GSE owner occupied and investor loans with balances between $250,000 and $350,000 originated in June of 2019 shows that prepayment rates were roughly identical until March of last year, decoupled substantially between March of last year and January of this year, and have subsequently converged. (Exhibit 1)
Exhibit 1: Attempting to normalize incentive across owner occupied and investor loans
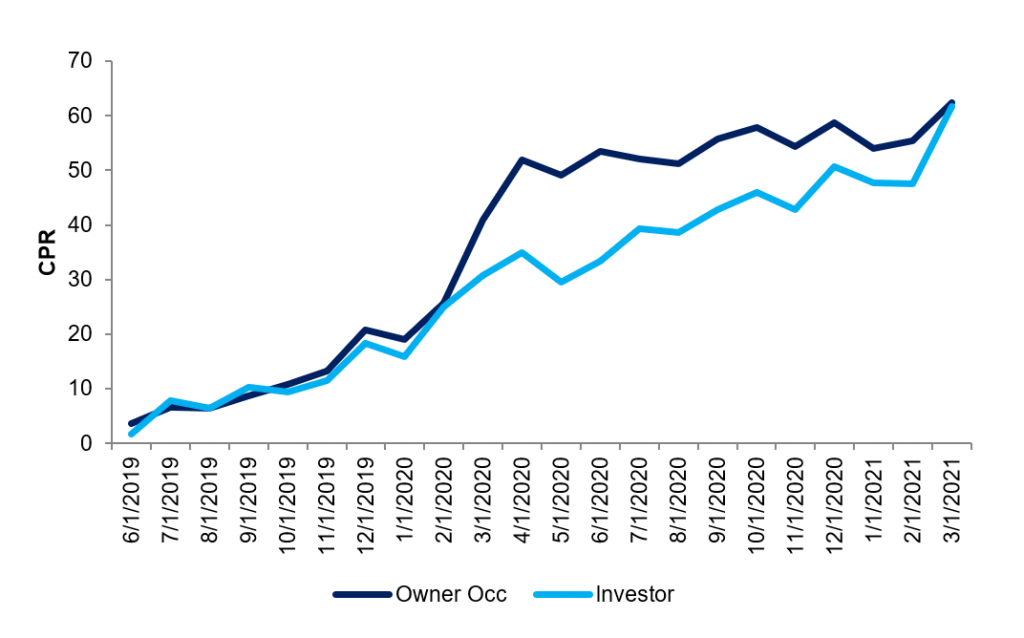
Source: Fannie Mae, Freddie Mac, eMBS, Amherst Pierpont
The 2020 delayed response to refinancing incentive in investor loans points to the second factor: the originators. As rates drop, refinancing volumes rise and capacity becomes constrained. Originators will typically prioritize refinances of owner-occupied loans that are easier and faster to underwrite than investor loans. That maximizes originators’ immediate P&L. But as capacity constraints abate—assuming continued low rates—investor loans with incentive will ultimately get refinanced at a rate comparable to owner-occupied ones.
This analysis suggests that into a pronounced drop rates, investor loans with the same amount of incentive will be less responsive to that incentive for some period of time but ultimately, if rates remain low and there is still incentive to refinance, investor loans may prepay at comparable rates as owner-occupied ones. The process frictions for refinancing an investor loan are important. And the recent caps on selling investor loans to the GSEs have likely increased the frictions. As long as those frictions persist, investor loans should continue seeing a measure of prepayment protection.
Thoughts on relative value
The relative value associated with pass-throughs backed by agency-eligible investor loans likely needs to be viewed through the lens of both an asset-liability and a total return manager.
Within the narrow spectrum of prime pass-throughs, those backed by investor loans appear to offer substantial relative value over those backed by jumbo loans as the difference in pricing between agency-eligible investor and jumbo pass-throughs private label space is a fraction of that in agency specified pools. Current 2.5% pass-throughs backed by agency-eligible investor loans price at roughly $1-24/32 back of their TBA benchmark while jumbo pass-throughs currently price at roughly $2-4/32 back of the same benchmark representing a pay-up of roughly 12/32 for the investor loans. Comparing this to investor and jumbo 2.5% agency specified pools shows roughly a 1-point differential in private label versus specified pool pricing: 2.5% coupon pools backed by investor loans trade to roughly an 18/32 pay-up over TBA while conforming jumbo pools trade at a 28/32 concession below TBA or an all-in spread of roughly 1-10/32s between the two specified stories.
For asset-liability managers, 2.5% pass-throughs and front sequentials backed by investor loans may offer some of the most attractive spread across ‘AAA’ structured products. On the front end of the curve, short sequentials backed by investor loans trade at $1-16/32 behind their FNCI 2.5% benchmark translating to a spread of roughly 100 bp over interpolated swaps and 2.8-year average life at a 15 CPR pricing speed. Front sequentials offer a significant spread pick up over ‘AAA’ classes of non-QM deals, which are currently trading in the context of 70 bp over interpolated swaps for a comparable average life (Exhibit 2). While some might argue that the incremental spread is compensation for increased extension risk in front sequentials, the steepness of the forward curve suggests that non-QM deals may not be economically feasible to call at their first call date, potentially introducing extension risk in that sector as well.
At a spread of roughly 110 bp over interpolated swaps, 2.5% pass-throughs backed by investor collateral offer significantly more spread than comparable duration CMBS and roughly equivalent spread to comparable spread-duration CLOs backed by broadly syndicated loans, potentially making them attractive options for insurance and bank portfolios to pair against liabilities pegged to the belly of the curve. Of course, the credit and convexity profiles across these alternatives are different. Insurance companies are likely content to concede some illiquidity associated with private label pass-throughs in exchange for an asset that carries an NAIC 1 designation at a relatively wide spread. Well enhanced prime pass-throughs will by and large carry a risk- based capital requirement equivalent to agency pass-throughs and CMOs for bank portfolios but require greater amounts of capital to be held against them under large banks’ CCAR stress tests. As a result, either smaller banks not subject to these tests or larger banks with surplus capital may look to add more exposure to these types of prime pass-throughs or sequentials.
Exhibit 2: A matrix of spreads across the curve in AAA rated securitized products
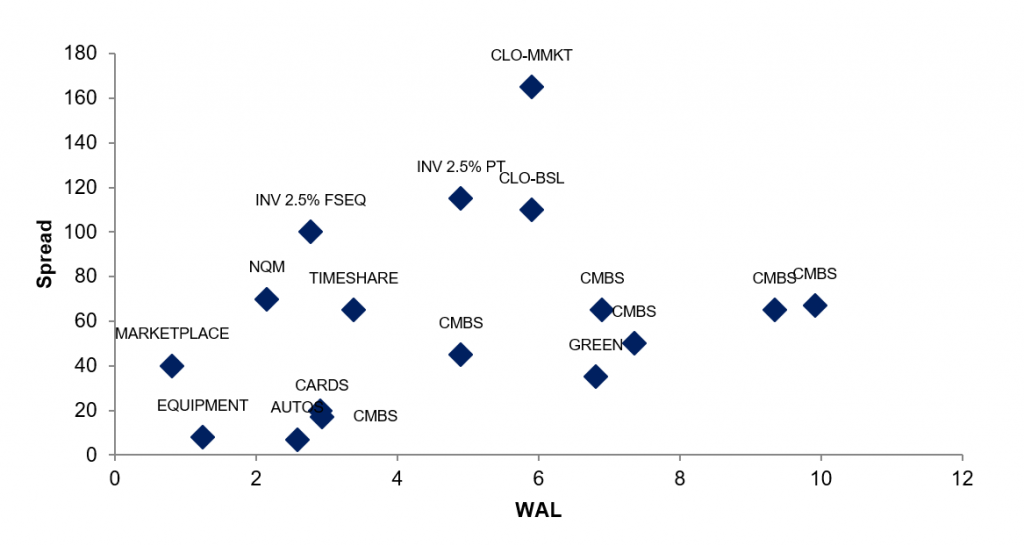
Source: Bloomberg LP, Amherst Pierpont
Despite the nominal cheapness of pass-throughs in private label space relative to investor specified pools, total return buyers may still gravitate towards dollar rolling TBA rather than owning funded positions in pass-throughs given that lower coupon pass-throughs, specifically UMBS 2.0% and 2.5%s are rolling special, potentially enhancing annual returns on TBA by and estimated 60 bp to 75 bp. Comparing a longer duration investor 2.5% pass-through to a duration and market value neutral position in FNCL 2.5% and 10-year notes shows that the investor pass-through only modestly outperforms the blend of MBS and Treasuries, after accounting for the incremental return afforded by the specialness of the dollar roll in 2.5%s, total return players will likely continue favor dollar rolling TBA versus owning funded positions in private-label pass-throughs.