


The Big Idea
Tapering on a tight timeline
Steven Abrahams | June 18, 2021
This document is intended for institutional investors and is not subject to all of the independence and disclosure standards applicable to debt research reports prepared for retail investors.
The lights flickered a little in the MBS market after the latest Fed meeting. Talking about talking about tapering has put pressure on MBS spreads for most of June, and now the new Fed dots show a median of two hikes by the end of 2023. A little history homework suggests the Fed might want to wrap up tapering on a surprising fast schedule. And this would likely come in a market with heavy net MBS supply. Demand down. Net supply up. Not a good equation for MBS.
The template of taper from 2013 to 2014 to hike in 2015
The Fed set the template for tapering and hiking after the 2008 financial crisis. After various rounds of QE, the Fed announced tapering on December 18, 2013. It announced it would reduce its $45 billion a month in Treasury purchases and $40 billion in MBS by $5 billion each at each FOMC meeting. It did that reliably, and tapering wrapped up on October 29, 2014. More than a year later, on December 16, 2015, it began hiking and then took several more years before actually starting to reduce its portfolio balances.
The ordering of taper-first-and-hike-later had a specific rationale likely to hold in the current cycle: don’t mix the two. The Fed knew it needed to frame tapering not as a tightening of financial conditions but as a deceleration in providing liquidity. Fewer purchases just mean less cash flowing into the system. A hike, on the other hand, does tighten conditions. Mixing the two could cause confusion. Decelerate first, tighten later.
Fed funds futures have the first hike priced in by February 2023, which immediately raises questions of whether the Fed will have room to maneuver using the old playbook. Of course, that playbook allowed discretion and depended on market conditions, but it also had to be predictable enough to avoid destabilizing markets. That playbook would require the Fed to wrap up tapering roughly a year in advance of a hike, say February 2022, and start tapering roughly two years in advance, say months ago. Clearly, if fed funds futures are right, that deadline has passed.
Adding to the challenge, the Fed is new buying $80 billion a month in Treasury debt—double the size of its purchase ahead of the last taper—and $40 billion a month in MBS. The old playbook would double the time to taper Treasury purchases. Of course, the depth of the Treasury market could easily allow the Fed to solve that problem by tapering in Treasuries at twice the earlier pace.
The Fed has some choices to make about how it will engineer tapering and liftoff. It may have to taper a little faster than the last time to accommodate a February 2023 hike or alternatively wait a bit less between the end of taper and liftoff. Or it could just push liftoff out.
The Fed influence on spreads
Tapering should widen MBS spreads unless some other suitor comes along to embrace the net supply the Fed would otherwise take out of the market. Banks would be unlikely since a rebounding economy usually creates more profitable opportunities to lend. The most likely suitor is money managers. And with investment grade and high yield spreads low and likely to remain low in a strong economy, wider MBS spreads eventually should spell compelling relative value.
In the meantime, the Fed has made a serious dent in outstanding agency MBS. It’s share of the market since the start of pandemic has jumped roughly from 20% to 30% (Exhibit 1). Work done by the Fed after its 2010s QE suggested for every 1% of the outstanding market owned by the Fed, MBS yields dropped 2.3 bp. That would give the current round of QE credit for 23 bp of MBS tightening. Tapering should reduce the rate of growth and the influence of the Fed on spreads. But it’s all about share. Even at the end of tapering, a growing market starts to drag down share. And that’s where the housing market comes in.
Exhibit 1: The Fed has bought 10% of outstanding agency MBS during pandemic
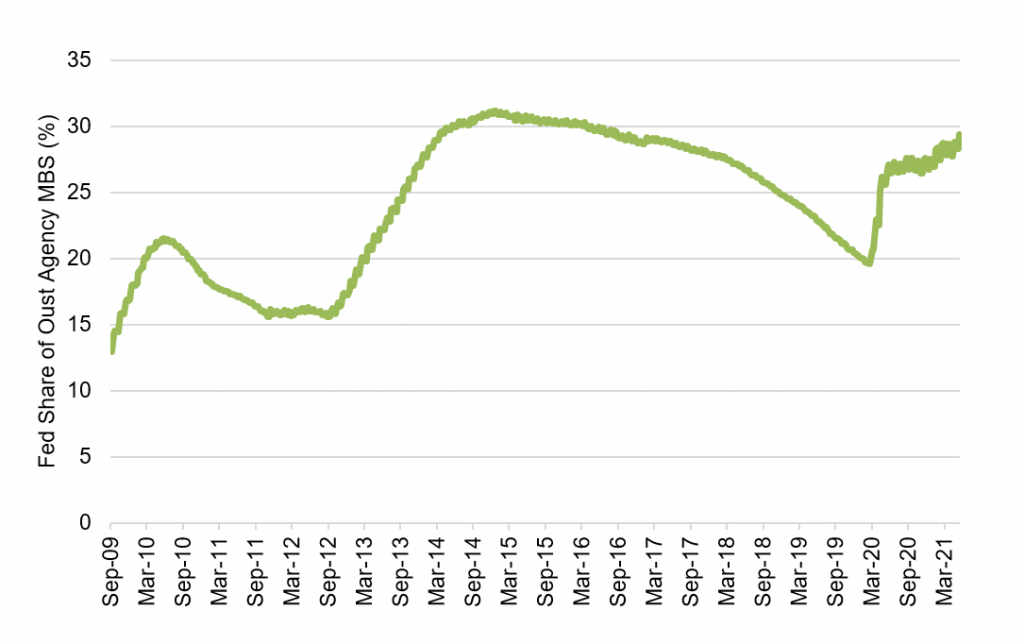
Source: Federal Reserve, Amherst Pierpont Securities
A hot market in housing should lift net MBS supply
Tapering over the next year or so should run headlong into a hot housing market likely to push net MBS supply to levels not seen in years. Strong demand for housing—fed partly by pent up buyers, pandemic rebound and relatively low mortgage rates along with strong home price appreciation—should fuel net MBS production more than four times the pace of 2018 and 2019 (Exhibit 2). With the Fed currently taking $40 billion a month out of the market and banks averaging more than $50 billion a month so far this year, demand has absorbed supply. Both sources of demand are likely to soften, and money managers do not bring the same wallet to the market.
Exhibit 2: Strong housing should drive heavy net MBS supply into 2022
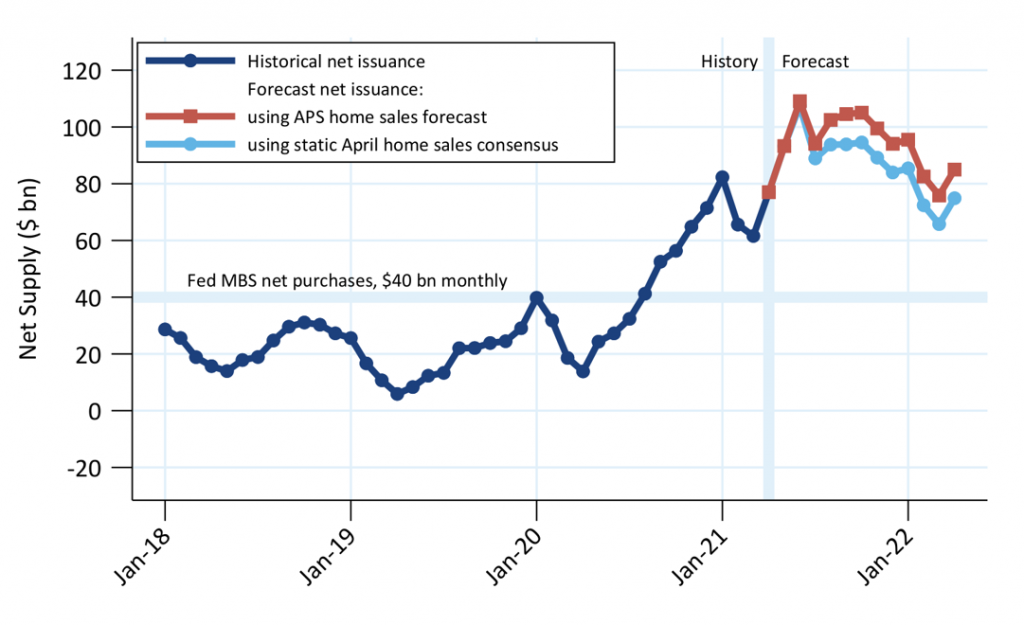
Note: see APS Portfolio Strategy, Expect elevated net supply for the remainder of the year, May 21, 2021.
Source: Amherst Pierpont Securities
Starting to price things in
Markets always are forward looking. Even though the par 30-year MBS spread to the Treasury curve widened only a basis point from close-to-close on the day of the FOMC, the math of MBS supply and demand looks challenging. There is plenty of uncertainty to parse about inflation and labor and the timing of Fed liftoff, but tapering, tapering on an accelerated timeline or tapering into a market with heavy net supply all should pressure MBS performance. There is recent discussion of refinancing risk in MBS as rates drop, and that could put some temporary pressure on spreads as refinancing usually does. But the bigger picture is the path of Fed tapering. The par 30-year MBS spread has widened roughly 10 bp since the start of June on taper talk, among other things. That only looks like a start.
* * *
The view in rates
The Fed shook up the money markets this week, bumping its RRP rate from 0 bp to 5 bp and lifting IOER from 10 bp to 15 bp. The response has been immediate. Overnight Treasury repo and SOFR have jumped by an appropriate 5 bp and balances at the RRP facility from FOMC day on June 15 to June 18 have rocketed up by $238 billion. Settings on 3-month LIBOR have moved only a few basis points higher, so the LIBOR-OIS basis has dropped to an extraordinary 3.83 bp. The front end is still awash in cash, but the Fed has put a higher floor on the complex.
The Fed mitigated some concerns about a persistent oversupply of cash in longer parts of the curve. On FOMC day, real rates spiked higher, suggesting expectations of a lower supply of cash over these longer horizons and a correspondingly higher price. Breakeven inflation dropped, but not enough to stop nominal rates from rising that day. The rates market since has quickly marked down inflation expectations, and the curve has flattened. The 10-year note has finished the most recent session at 1.44%, down 1 bp on the week, despite 10-year breakeven inflation at 2.24%, down 10 bp on the week. The negative 81 bp 10-year real rate implies is up from a week ago.
The Treasury yield curve has finished its most recent session with 2s10s at 118 bp, 12 bp flatter from just a week ago. The 5s30s curve has finished at 114 bp, flatter by 26 bp from a week ago.
The view in spreads
MBS spreads have widened notably in recent weeks. The nominal spread between par 30-year MBS and the interpolated 7.5-year Treasury yield closed recently at 72 bp, wider by 2 bp in the last week. Refi risk may also be creeping back into MBS. Primary 30-year mortgage rates have dropped below 3.0% in several surveys, and data from the Bureau of Labor Statistics show employment in the mortgage industry up 30% from three years ago, giving originators plenty of capacity to chase loans. But a quickening of Fed hikes and the timing of tapering are much bigger issues likely to weigh on spreads.
In credit, low rates should continue supporting corporate balance sheet strength. Ratios of EBITDA to interest expense are in the middle of the range despite high ratios of debt to EBITDA. Investor demand for yield should keep spreads relatively tight. A strong economy should help credit spreads, but relative value flows at money managers could still soften credit spreads if MBS gets wide enough.
The view in credit
Consumers are strong and most corporations in good shape. Fundamental credit should hinge on whether the Fed can orchestrate a soft landing as it starts to tighten financial conditions. Consumers finished the first quarter of 2021 with net worth up $5 trillion. Aggregate savings jumped again as did home values and investment portfolios. Consumers have not added much debt. Corporate balance sheets have taken on more leverage, although mitigated by strong cash balances and low interest costs. EBITDA-to-interest-expense is at healthy levels. Strong economic growth in 2021 and 2022 should lift most EBITDA and continue easing credit concerns. Eventually, rising interest expense in 2023 should compete with EBITDA growth.