


By the Numbers
How seasoning impacts refi incentives in Ginnie Mae project loans
Mary Beth Fisher, PhD | July 13, 2021
This document is intended for institutional investors and is not subject to all of the independence and disclosure standards applicable to debt research reports prepared for retail investors.
The mix of Ginnie Mae project loans that prepay varies across the interest rate cycle. When rates are static or rising, prepays tend to come predominantly from very seasoned loans with low remaining penalties, and from borrowers tapping equity. During refinance waves, the proportion of high penalty loans that prepay rises sharply, though the average rate reduction achieved is well below that of seasoned loans. This discrepancy is due to a combination of very seasoned loans requiring a larger rate incentive to reset the penalty string, and high penalty loans accepting smaller rate reductions so the refi proceeds covers the penalties. Investors in IOs, especially IOs with high coupons, should know this dynamic.
Prepayments of Ginnie Mae project loans began to pick up in 2019, then accelerated rapidly during 2020 and into 2021 (Exhibit 1). Project commitment (PLC) rates averaged 3.50% during the second half of 2016 through most of 2017, then rose by 50 bp to average 4.00% by the second half of 2018 and remained there for about a year. PLC rates declined by 50 to 75 bp during 2019, before the pandemic-driven rally pushed to historic lows of about 2.50%.
Exhibit 1: Historical prepayments vs project loan commitment rates
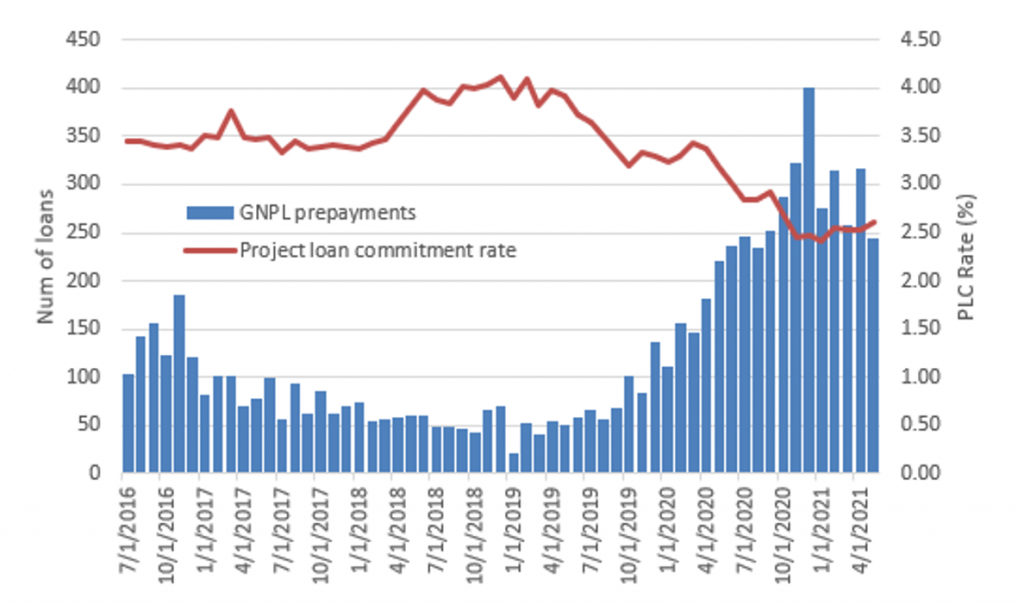
Note: Data is monthly and includes both voluntary and involuntary prepayments, though involuntary prepayments are quite small. Although not shown, the pick-up in prepayments in the second half of 2016 was in part due to a 75 bp rally in the 10-year Treasury during the first half of that year.
Source: Ginnie Mae, HUD, eMBS, Intex, Bloomberg, Amherst Pierpont Securities
The WALA of loans that prepay varies over the rate cycle
The weighted average loan age (WALA) of project loans that prepay tends to decline when rate incentives are high and extend when rate incentives are low (Exhibit 2). During the second half of 2016 when prepayments spiked, the average WALA of prepaid loans fell rapidly from just over 7 years (85 months) to 5.5 years (65 months). The average loans prepaying at that time were from the 2010 to 2012 vintages and likely had 5 points of penalties remaining.
Exhibit 2: Average WALA of GNPL prepayments since 2016
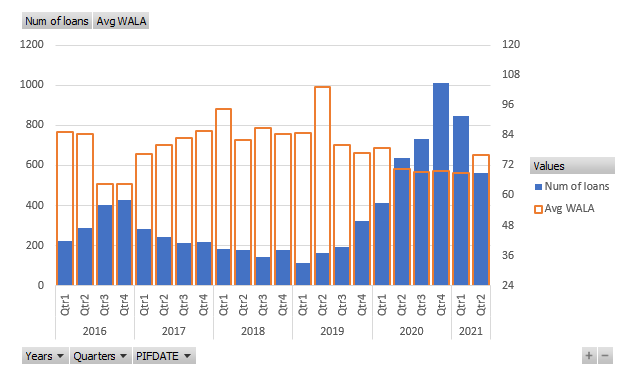
Source: Intex, Amherst Pierpont Securities
This is consistent with the S-curve by penalty points (Exhibit 3) which shows a pronounced jump in historical average prepay speeds from 11 to 18 CRR as a loan moves from 6 penalty points to 5. For a loan with a typical 10(12), 9(12), 8(12), …, 1(12) penalty structure, the loan would drop to 5 penalty points after 60 to 72 months, assuming a 0 to 12 month lockout period.
Conversely, when rates have risen and fewer loans are likely in the money to refinance, the average WALA of loans that do prepay extends significantly. In the first quarter of 2018 when commitment rates were rising by 50 bp, the average age of loans that prepaid was nearly 8 years (95 months), and during the second quarter of 2019 that extended to a high of 8.6 years (103 months).
Exhibit 3: S-curve by penalty amount
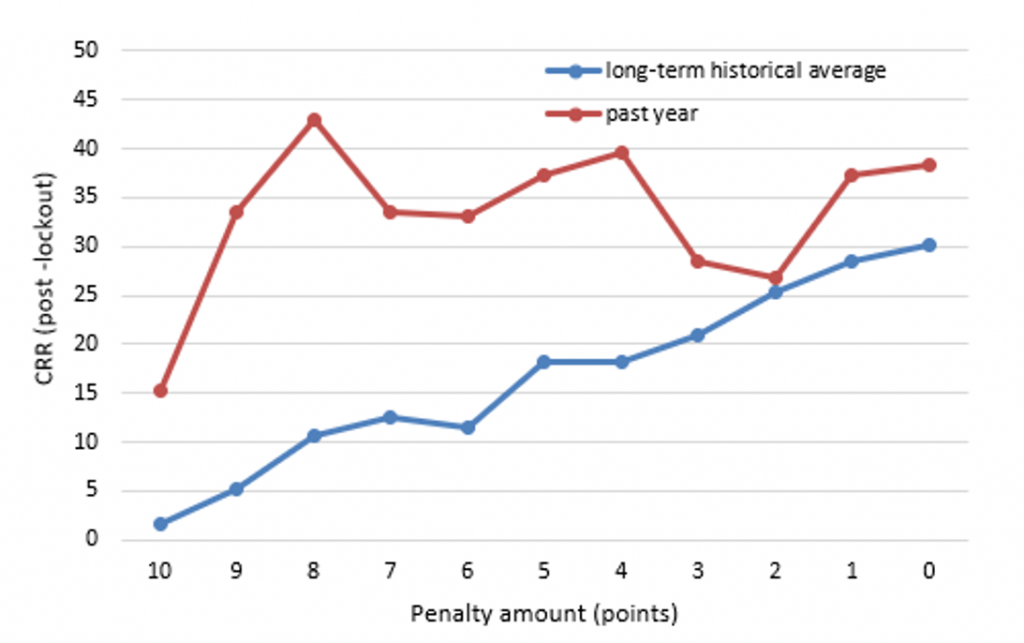
Note: The long-term S-curve represents average prepay speeds of all loans prior to June 2019.
Source: Ginnie Mae, HUD, eMBS, Intex, Bloomberg, Amherst Pierpont Securities
One of the hallmarks of the pandemic-induced prepayment wave for project loans is the acceleration of prepayment speeds for loans with heavy penalty points still attached (Exhibit 4). Average speeds have about doubled across all penalty cohorts during the pandemic-driven refi-wave compared to the prior one in 2016. But for loans with 7 to 8 points, peak speeds have approximately tripled from 15 to 45 CRR, and in some months the 3-month average speeds for that cohort has exceeded the speeds of all others (purple line).
Exhibit 4: Prepayment speeds by penalty cohort
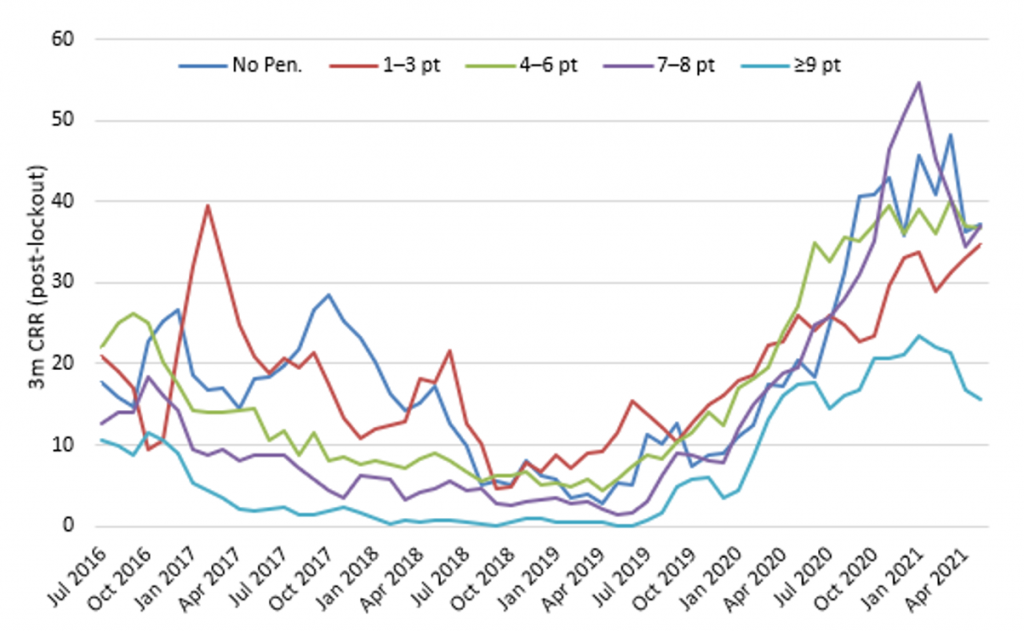
Source: Ginnie Mae, HUD, eMBS, Intex, Bloomberg, Amherst Pierpont Securities
Estimating the required rate incentive to refinance
A standard prepayment model assumption is that the value of the rate incentive has a be able to completely offset the cost of the prepayment penalty plus origination fees for a borrower to refinance. The required refinance incentive can be estimated as:
Required refi incentive = change in price / duration
Assuming a 1% origination fee and a duration of 8.0 for the mortgage, the required rate incentive that allows a borrower to perfectly offset the cost of the points + origination fees varies from 138 bp for a loan with 10 penalty points to 25 bp for a loan with only one penalty point remaining (Exhibit 5). As a shorthand, the rate change required to cover a 1.00% change in price or a 1.00% penalty point is:
Rate change required to cover 1.00% penalty = 1.00% / 8 = 12.5 bp per point
Exhibit 5: Theoretical rate incentive required for a borrower to refinance
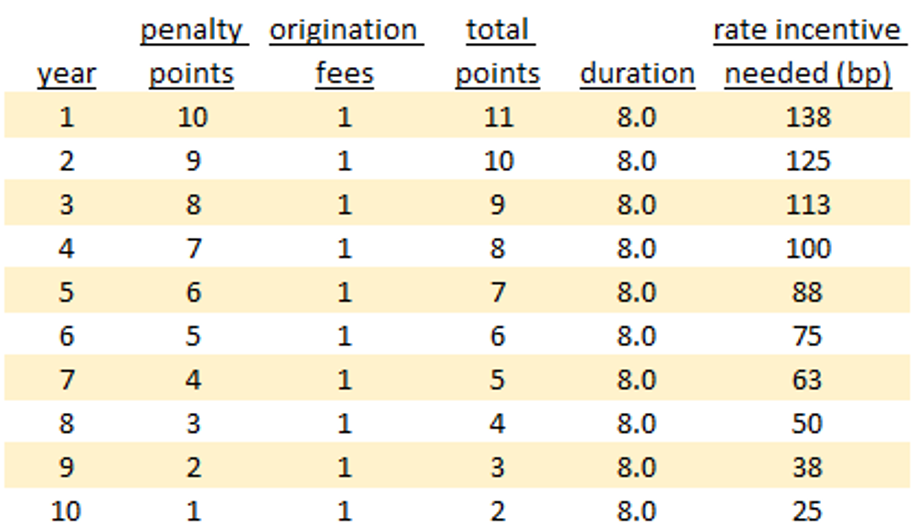
Source: Amherst Pierpont Securities
There is a reasonable economic argument that a rate drop which exactly offsets the costs of refinancing is required to drive refi activity. However, empirical evidence doesn’t support that argument:
- Longer WALA loans with low penalties appear to require a greater rate incentive to offset the penalty and origination points than would be expected; and
- Short WALA loans with high penalties refinance for rate incentives that are well below what is putatively required to breakeven on the loan.
Low WALA, high penalty loans prepay at lower rate incentives
A summary of average loan age at the time prepayment and the average change in the coupon achieved when the loan was refinanced is shown in Exhibit 6. The analysis is broken into two groups: low WALA loans ( <= 36 months) and all others.
Exhibit 6: GNPL prepayments for low WALA loans
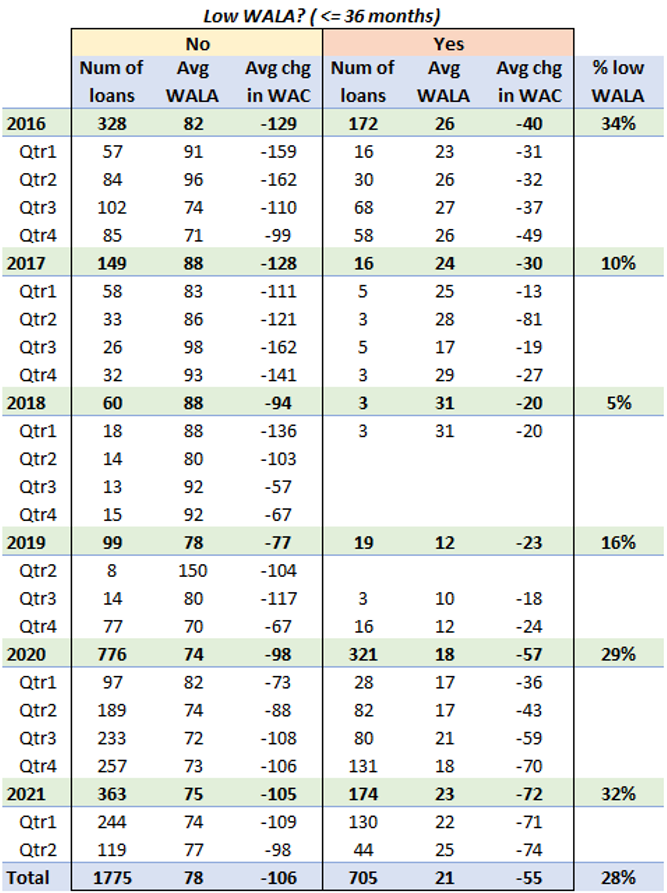
Note: This analysis conducted on the subset of project loans that prepaid where a new project loan immediately appeared on the same property. This was primarily the result of interest rate reductions and the change in WAC can be calculated from the previous loan to the new loan. Of the nearly 8000 loans that have prepaid since 2016, this subset represents 2480. Some of the prepaid loans may not have taken out another mortgage, others may have refinanced with other lenders, and for some it is possible that the identifying details of the loan changed enough that the data does not recognize it as a new loan on the same property.
Source: Intex, Amherst Pierpont Securities
The coupon difference is the actual rate change that the borrower received during the refi. Not only is the coupon reduction for the low WALA, high penalty loans not nearly enough to offset the costs, they are also much lower on average than the rate reductions achieved by the more seasoned, high WALA loans.
Higher WALA loans may be reluctant to reset to higher penalties
The lowest average rate savings achieved for the high WALA loans was 57 bp in the third quarter of 2018, for loans with an average age of 7.6 years (92 months). Based on the table in Exhibit 5, the 7 to 8 year loans with standard penalty schemes likely have 3 to 4 penalty points remaining, which would require a 50 to 63 bp incentive to perfectly offset the costs. This is about as flat to costs as the data gets, and curiously was in the middle of the absolute trough of prepayments that lasted throughout 2018 and into the first half of 2019. There were close to zero low WALA loans that prepaid during this time.
The highest average rate savings of 162 bp occurred for a quarter in 2016 and again in 2017, for loans that had an average age of 8 years. That’s fully 112 bp through the breakeven rate incentive of 50 bp. During 2020 and so far in 2021 the average coupon reduction has been about 100 bp with a loan age of just over 6 years, which likely equates to a refi incentive of 25 to 30 bp over costs.
Borrowers with higher WALA loans, particularly those that are over 60 months, have lower prepay penalties – usually below 5 points. Executing a refinance restarts the penalty clock. Although a lower interest rate can improve the credit metrics of a property by increasing the DSCR, assuming the loan amount stays the same, it can be an impediment if a borrower wants to take out equity with a new loan. If the goal is lower barriers to future sales or cash-out refis, a borrower with a high WALA loan should and does require a greater rate incentive to add back those penalty points.
Low WALA loans can refinance into super premium pools
Although prepayment speeds have picked up across the board over the past 5 years, in part due to efficiency and aggressive marketing by originators, this is not a new phenomenon. The overall proportion of prepayments attributable to low WALA loans is about 32% this cycle, nearly the same as it was in 2016 (34%). Although it’s difficult to evaluate the composition of loans that have various penalty strings over time, it appears that the proportion of loans that retain 10 point penalties for 2 to 5 years before declining may be increasing.
Throughout 2017 project loan commitment rates were pretty stable at 3.50%. While the average rate reduction achieved for high WALA loans was 128 bp, low WALA loans that prepaid did so for a 30 bp rate reduction. On average these loans were 2 years old and required a 125 bp rate incentive to breakeven on the costs to refinance. In 2020 and so far in 2021 the rate reduction achieved has improved to 57 and 72 bp, but the average age of the low WALA loans that have prepaid shortened to 18 and 23 months, respectively. Still well short of what it would require to cover the penalty and origination costs out of pocket.
So why are these borrowers with high penalty loans refinancing? Because they aren’t paying the penalty and origination fees out of pocket. Instead, these borrowers can refinance into a super-premium pool, achieve a rate reduction and cover the penalty points and fees from the new loan.
For example, assume the following sequence:
- Day 1, PLC rate is 4% for a loan with a standard 10,9,8,… point penalty structure. It sells for $101-00. The borrower gets $100-00 and the originator is paid $1-00.
- Day 2, PLC rate plummets to 2.5%. A new 2.5% loan with the same 10,9,8… point penalty structure sells for $101-00. The 4.0% loan is now worth $113-00 [= $101-00 + 1.50% * 8].
Suppose a borrower originated a loan on Day 1 at 4.00% and decides to lock in a refinance on Day 2. Using the 8 -year duration the 150 bp rate difference would cover [=150*8/100] 12 points. In order to have the proceeds from the new loan cover the costs, this borrower would presumably refinance into a loan with a rate of 3.75% [=2.5%+(10/8)] that sells for $111-00. They get $100-00 for principal, $10-00 for penalties, and the originator gets $1-00. They covered the costs and have a 25 bp rate reduction.
Compare that to a high WALA loan with the same 4% current rate but a 2 point penalty. That borrower would be able to refinance to 2.75%=[=2.5%+(2/8)]. That loan sells for $103-00 with $100-00 principal, $2-00 penalties, $1-00 to originator. That borrower covered costs and has a 125 bp rate reduction.
There is also less disincentive for the low WALA borrower to refinancing and resetting the penalty string. A borrower with a 2 to 3 year old loan that still has 7 to 10 penalty points attached may be relatively indifferent to resetting to higher or equivalent penalty points over a new 10-year term.
Seasoned loans more likely to tap equity
Last point – loans where new or existing borrowers take out equity from a property have on average longer WALAs (Exhibit 7). Over the last 5 years, 15% of project loans that have refinanced had a second loan balance that was higher than the first. The average WALA was 72 months compared to 60 months for loans that did not have an equity takeout. The additional time allows for more price appreciation and loan amortization, all else being equal.
Exhibit 7: GNPL prepayments with equity takeout
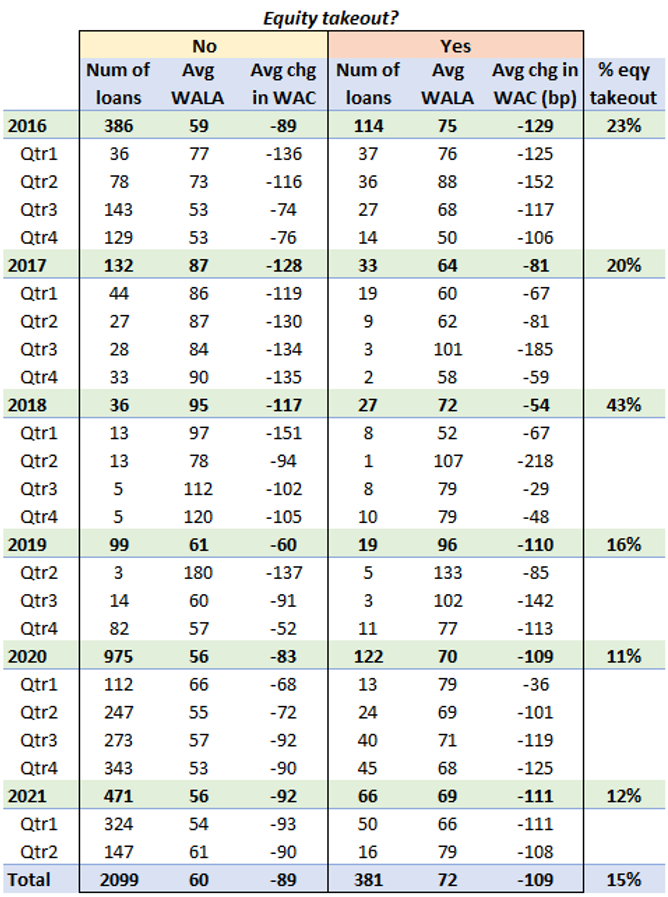
Note: This analysis conducted on the subset of project loans that prepaid where a new project loan immediately appeared on the same property. This was primarily the result of interest rate reductions and the change in WAC can be calculated from the previous loan to the new loan. Of the nearly 8000 loans that have prepaid since 2016, this subset represents 2480. Some of the prepaid loans may not have taken out another mortgage, others may have refinanced with other lenders, and for some it is possible that the identifying details of the loan changed enough that the data does not recognize it as a new loan on the same property.
Source: Intex, Amherst Pierpont Securities
In 2017 and 2018, as interest rates were static or rising, equity takeouts surged to 20% and 43% of refinanced project loans and the average WALAs of those loans dropped below those of which did not takeout equity. This modest reversal appears to have been driven by a hangover of very seasoned loans that were still able to refinance for large coupon reductions.