


By the Numbers
Call risk on the rise in non-QM trusts
Chris Helwig | July 30, 2021
This document is intended for institutional investors and is not subject to all of the independence and disclosure standards applicable to debt research reports prepared for retail investors.
The recent drop in rates has increased negative convexity in many non-QM trusts as both call and prepayment risk have gone up. Recently issued deals with higher advance rates and lower costs of funds should provide some protection since those factors raise the bar for issuers to call deals. But those same factors will likely create significant incentives to call more seasoned trusts with lower leverage and more credit curing. As for prepayments, investor loans and loans with non-traditional underwriting may help shield investors against faster speeds.
Analyzing call risk in non-QM
Declining delinquency rates have translated to lower expected cumulative losses across the non-QM market. Improved collateral performance on seasoned non-QM trusts and lower rates have pushed the average price of loans backing seasoned non-QM trusts well above par. Pricing the universe of non-QM collateral to a 200 bp discount margin suggests that the average price now tops $105.50, a big premium over sponsors’ par call (Exhibit 1).
Exhibit 1: Loans backing non-QM trusts are valued well above par
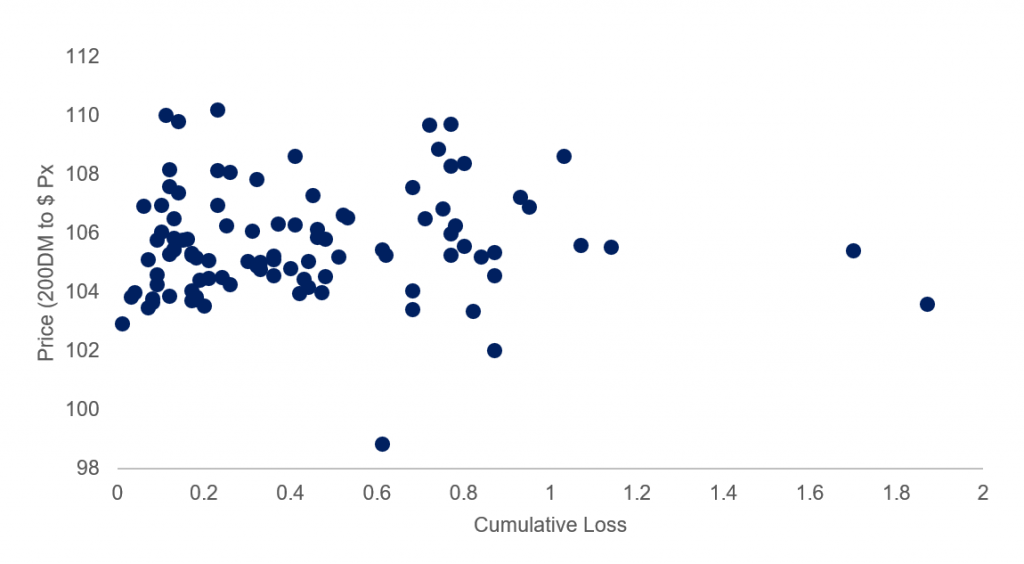
Source: CoreLogic, Intex, Amherst Pierpont
Higher collateral valuations have also helped increase advance rates on non-QM securitizations as sponsors can satisfy risk retention requirements, which are based on market value, by holding smaller amounts of principal bonds. The recently issued CSMC 2021-NQM5 transaction issued liabilities rated ‘AAA’ through ‘B’, which in aggregate translated to an advance rate of 99.45%. Additionally, the cost associated with issuing down to a ‘B’ attachment point was only 86 bp or an all-in cost of funds of 1.21% assuming a weighted average life of 2.33 years on the liabilities issued. (Exhibit 2) These elevated advance rates should translate to significant incentives for sponsors to exercise options on currently callable trusts to increase leverage and reduce their cost of funds.
Exhibit 2: Currently non-QM securitizations achieve high advance rates and low COF
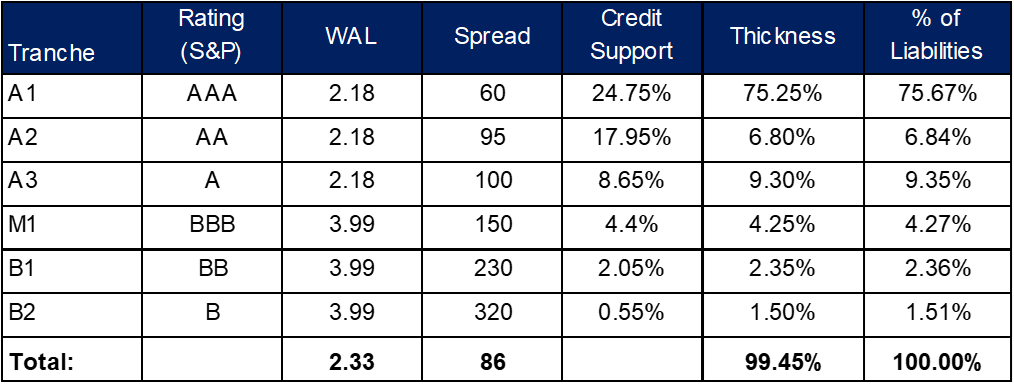
Source: Bloomberg LP, Amherst Pierpont
Looking at recent call activity shows that sponsors have been more aggressive in calling trusts during periods of lower rates throughout this year. A large number of deals were called in the first quarter of this year with another increase in June. Nearly $5 billion of collateral with a weighted average gross coupon of 6.4% has been called through the first six months of the year across nine shelves.
The VERUS shelf has seen the largest amount of collateral called this year, totaling just more than $1.5 billion across eight trusts. Elevated call volume in VERUS trusts appears primarily driven by higher-than-average WACs on the deals as the weighted average gross WAC on called loans was 6.78% or roughly 40 bp higher than the average WAC on the broader universe of called loans.
Away from the VERUS shelf, Pretium’s DRMT shelf saw the next largest volume of collateral called as the sponsor has called nine deals, totaling close to $1 billion worth of collateral through the first six months of the year. Both the VERUS and DRMT deals ranged from deals issued as far back as 2017 to those issued as recently as 2019. Similar to VERUS trusts, the Deephaven deals exhibited higher average gross coupons than the broader universe of loans called. This is unsurprising as both the VERUS and DRMT shelves are often comprised of larger amounts of riskier loans with higher amounts of SATO. The sponsors’ decisions to execute call options on this type of collateral suggests that risk premia on these types of loans have tightened substantially in the wake of the broad shut down in non-QM lending last spring. Conversely, the deal with the lowest WAC called this year was the ARRW 2018-1 transaction, which was called in June and had an original gross WAC of 5.28%. WAMCO’s Arroyo shelf is generally comprised of cleaner credits with lower coupons and lower amounts of SATO (Exhibit 3). Given this, the non-QM market is effectively bifurcated into seasoned trusts with higher WACs and a higher cost of funds that have significant immediate call risk and more recently issued deals with materially less call risk.
Exhibit 3: Looking at recent call activity across non-QM
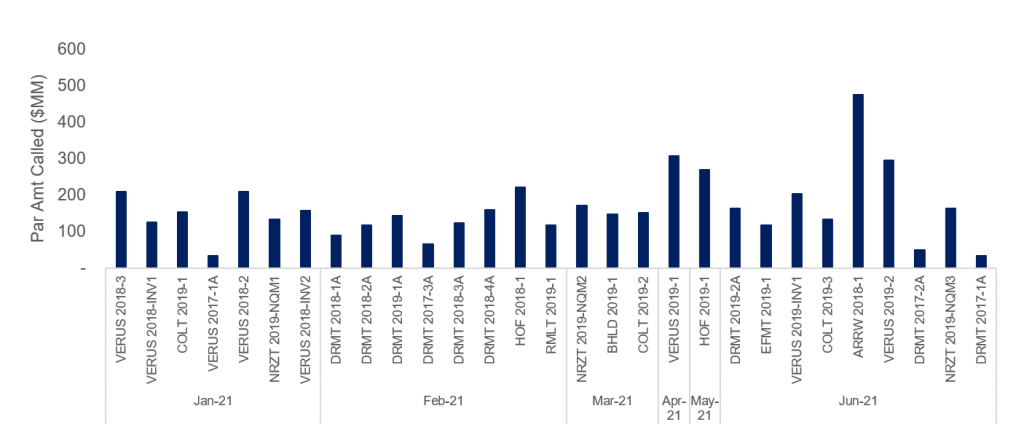
Source: CoreLogic, Intex, Bloomberg LP, Amherst Pierpont
Analyzing prepayment risk in non-QM
Given the relatively diverse nature of loans backing non-QM trusts, it is difficult to get concentrated prepayment protection. Deals are often backed by both fixed- and adjustable-rate loans with different refinancing incentives. Differences in risk-based pricing or SATO also make it challenging to estimate refinancing incentives across non-QM deals as well. Additionally, deals can often be backed by both owner-occupied and investor loans that may exhibit different prepayment speeds even after attempting to normalize for both SATO and incentive. With that said, deals backed by larger concentrations of investor loans, particularly those underwritten using rental income rather than borrower income, may afford investors with greater protection against rising prepayment risk.
Looking at broad prepayment rates across non-QM loans after adjusting for solely for risk-based pricing shows that loans backed by investor properties with 50 bp of refinancing incentive have on average prepaid at 22 CRR while those backed by owner occupied loans with 50 bp of incentive have prepaid at nearly 35 CRR. A similar analysis looking at only fixed-rate loans shows still shows a substantial disparity between owner-occupied loans prepaying at 30 CRR and investor loans paying roughly 10 CRR slower. Applying the same analysis to hybrid ARM loans shows an even greater disparity with owner-occupied loans prepaying at 36 CRR and investor loans prepaying 13 CRR slower. Obviously, this does not account for other collateral differences that could contribute to faster speeds, particularly loan balance. However, after looking at the same analysis controlling for balances between $400,000 and $600,000, the difference in speeds between the two ARM cohorts is roughly 14 CRR and the difference is even more pronounced across fixed-rate loans with owner-occupied collateral prepaying nearly 20 CRR faster than investor loans with 50 bp of incentive.
It appears that some of the prepayment protection afforded by investor collateral is a function of alternative forms of underwriting, particularly using a Debt Service Coverage Ratio based on properties’ rental income rather than borrowers’ to underwrite the loan. Conversely, owner-occupied loans that do not use borrower income for underwriting appear to offer very little prepayment protection. Non-traditionally underwritten owner-occupied loans, those that use asset depletion rather than the borrowers’ income prepay substantially faster than investor loans that are underwritten using rental income (Exhibit 4).
Exhibit 4: Non-traditionally underwritten investor loans prepay slower
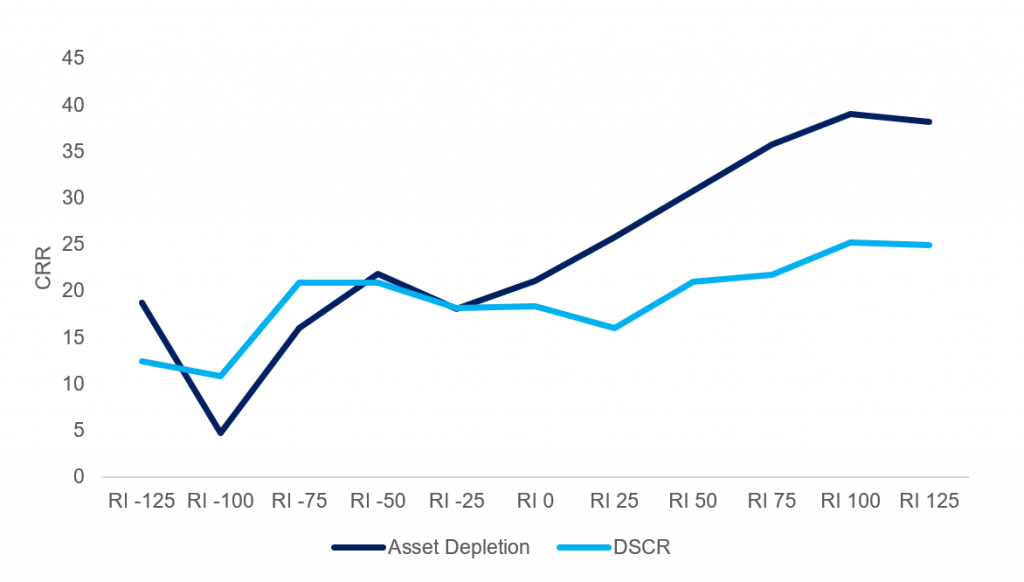
Source: CoreLogic, Intex, Amherst Pierpont