


The Big Idea
Strong corporate fundamentals, resilient spreads
Steven Abrahams | September 24, 2021
This document is intended for institutional investors and is not subject to all of the independence and disclosure standards applicable to debt research reports prepared for retail investors.
Corporate spreads have held in well for months and since mid-August have rallied to some of their strongest levels in years. This has come even as MBS has gone soft ahead of Fed tapering. The IG-MBS spread gap has narrowed from 30 bp in late May to 12 bp today. Differences in core buyers likely explain some of the uncoupling of credit and MBS spreads, but credit is getting a serious lift from its fundamentals. Aggregate earnings, margins, leverage and liquidity are looking as strong as ever.
The narrowing between investment grade corporate credit and MBS has largely come since late May (Exhibit 1). Talk of Fed taper started picking up then and has had a predictable affect on MBS. The Fed and banks have been the only net buyers of MBS since March 2020, Lower Fed demand along with diminished appetite from banks—less QE, less deposit growth, less need to invest—started getting priced in. Corporate spreads might have shown some softness in sympathy, but core buyers in credit continue to grow their portfolios. Mutual funds, international investors and insurers continue to see cash coming in.
Exhibit 1: Since late May, the IG-MBS gap has narrowed from 30 bp to 12 bp
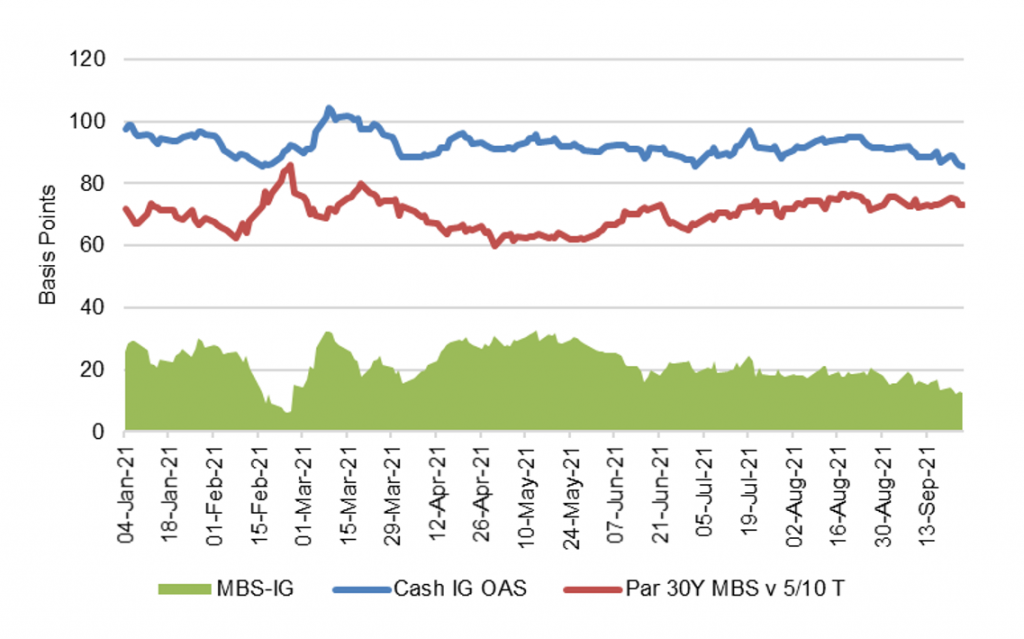
Source: Bloomberg, Amherst Pierpont Securities
The steady bid for credit might look like a pure technical, but the aggregate fundamentals on nonfinancial corporate balance sheets look strong starting with record levels of absolute profits (Exhibit 2). Many companies cut costs at the start of pandemic far faster than revenues fell and have since been able to pass along most input inflation to customers awash in federal support and benefiting from the quick Covid rebound. There is some concern, including among my colleagues in corporate strategy, that ability to pass along inflation will start to fade in the second half of 2021 as both fiscal support and growth moderate. That is plausible, but profits would decline from extraordinarily high levels.
Exhibit 2: Record absolute nonfinancial corporate profits
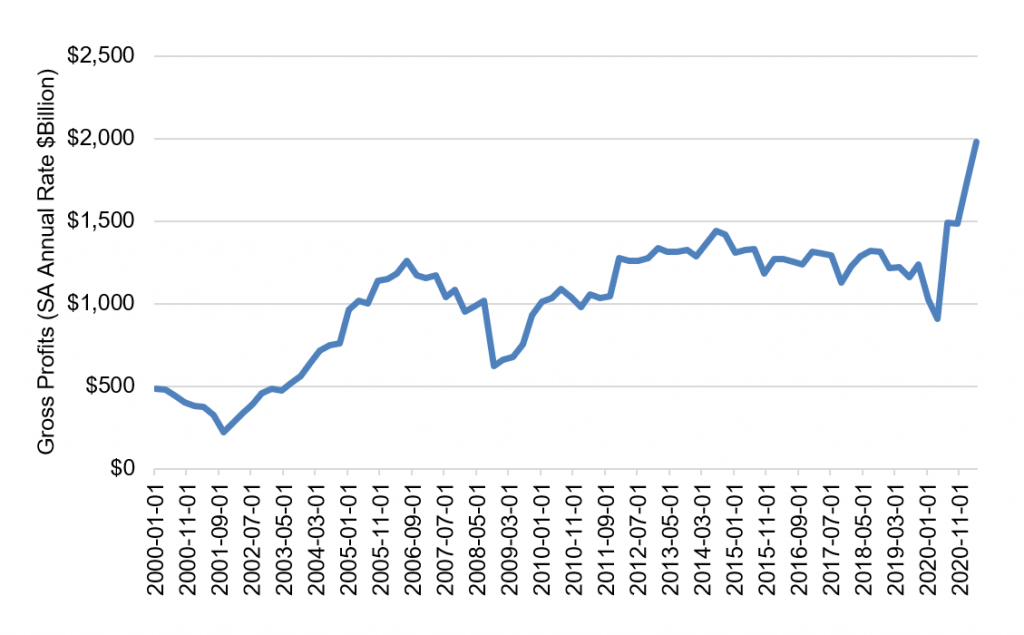
Note: Profits before tax, seasonally adjusted annual rate.
Source: Federal Reserve
It is also worth noting that the extraordinary profitability is not just a lift from growth. Efficient cost management and some customer price insensitivities have expanded margins (Exhibit 3). Gross profits as a percentage of total value added by nonfinancial corporate business—essentially profits as a share of sector GDP—have jumped to some of their highest levels since 2005. Nearly 18% of every dollar in value added is now profit.
Exhibit 3: Profit margins also have surged
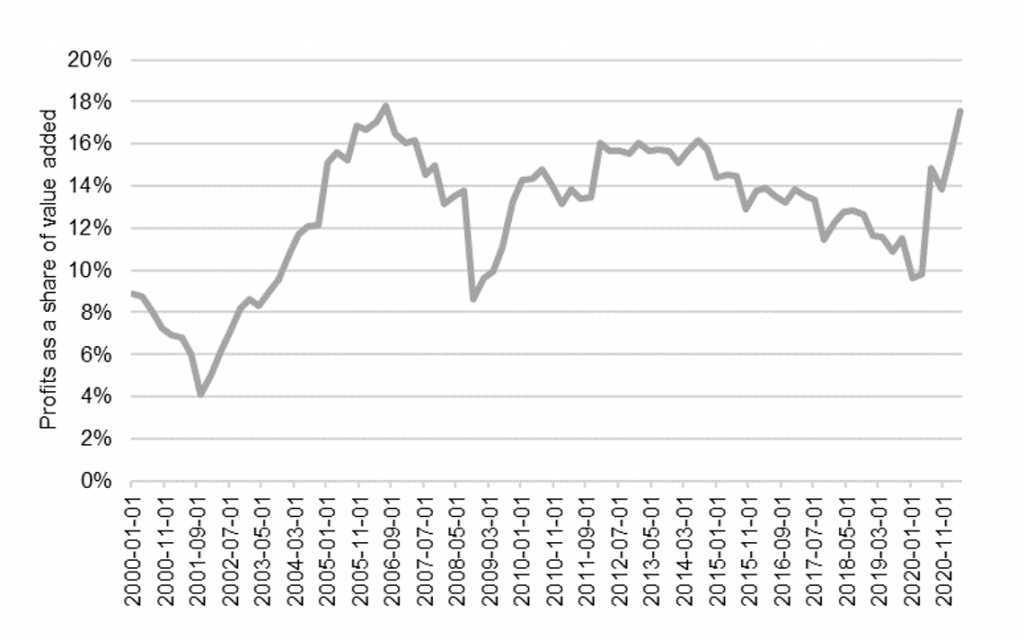
Note: Nonfinancial corporate profits before tax as a percent of gross value added.
Source: Federal Reserve
Nonfinancial businesses have definitely added debt, but surging profits have delevered an important part of the risk. Corporate issuance, leveraged loan issuance and private debt have all grown aggressively through pandemic even through bank lending to business has pulled back. But rising profits have far outstripped higher absolute balances in corporate bonds and loans. Nonfinancial businesses in the last quarter of 2019 held 8.17 times gross profits in debt but, as of the first quarter of 2021, only held 6.47 times (Exhibit 4).
Exhibit 4: Higher profits have deleveraged corporate balance sheets
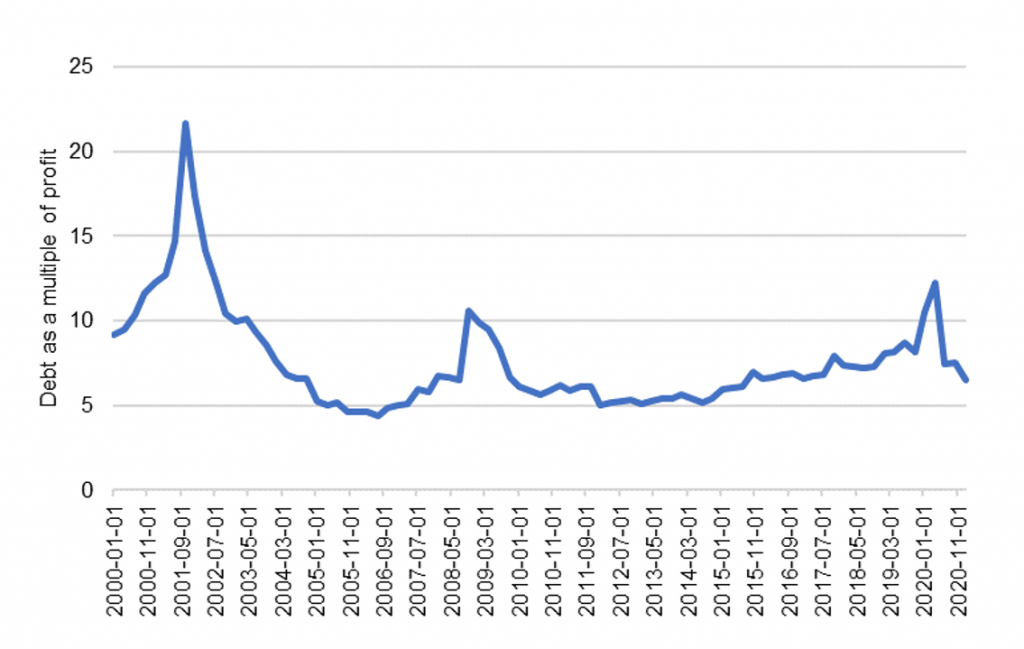
Note: nonfinancial corporate debt (bonds and loans) as a multiple of gross profit.
Source: Federal Reserve
Needless to say, low interest rates have further delivered nonfinancial businesses by increasing their ability to service their debt. Many companies have aggressively refinanced older, more expensive bonds and loans. Gross profits as a multiple of interest payments stand just shy of 8x, the highest level this century (Exhibit 5).
Exhibit 5: And increased debt service coverage
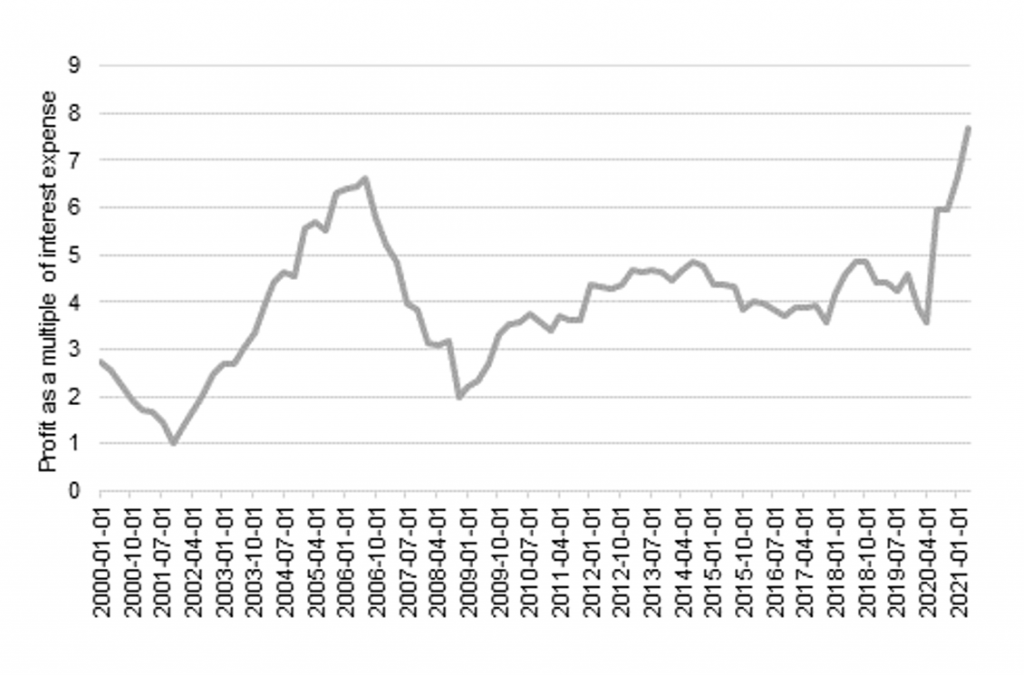
Note: nonfinancial corporate debt (bonds and loans) as a multiple of gross profit.
Source: Federal Reserve
Finally, much of the funds raised through bonds and loans by nonfinancial businesses has ended up on balance sheet in checking and savings accounts, money market funds and other cash investments. Companies started warehousing cash at the outset of pandemic because of the tremendous uncertainty about the course of the economy and continue to hold onto a large part of it. Cash as a share of corporate financial assets peaked at 16.8% in the second quarter of 2020 and has since dropped to 15.0%, still high by historic standards (Exhibit 6). Corporations have plenty of liquidity for dealing with continuing uncertainty about the course of pandemic.
Exhibit 6: Corporate balance sheets also show strong liquidity
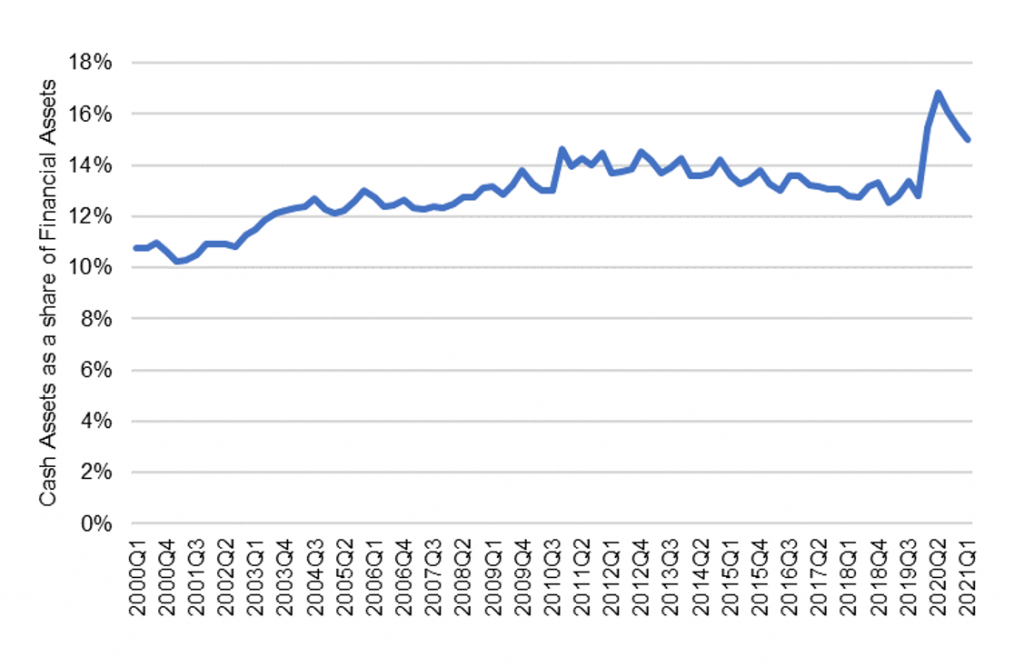
Note: checking, savings, money market accounts and repo as a share of total nonfinancial corporate assets.
Source: Federal Reserve Z.1
Investment grade and high yield corporate spreads are near record tights, and the average leveraged loan is now trading above $98. The technical are strong, and the financial system is awash in cash that needs yield. But corporate balance sheets are going into taper from a position of strength. That should be enough to carry most companies comfortably through the end of taper and likely to the point where the Fed starts to renormalize its balance sheet. At that point, fundamental growth should be sufficient. The tight spreads are not just technical. Fundamentals support current valuations.
* * *
The view in rates
The Fed in the last week raised the individual counterparty limit on its RRP facility from $80 billion to $160 billion, and balances quickly hit a new record. It is closing Friday at $1.313 trillion, up $97 billion over a week. RRP yields of 5 bp still top those on Treasury bills out to mid-October, and QE continues to add new cash to the financial system. Fannie Mae and Freddie Mac look like the major drivers of the most recent surge.
Settings on 3-month LIBOR have stayed around 12 bp lately and closed Friday at 13.2 bp, a level probably considered at the high end of the recent range. LIBOR clearly is trading with an eye on transition to other benchmarks by June 30, 2023. All interdealer swap trades will use SOFR by October 22, with dealers, banks and others urged to create no new LIBOR exposures after December 31 this year.
The 10-year note has finished the most recent session at 1.45%, up 9 bp from a week ago and one of the largest week-over-week moves in a while. Chalk it up to the FOMC and its intent to taper and hike. Breakeven 10-year inflation is at 234 bp, down 2 bp from a week ago but still with its range since June. The 10-year real rate finished the week at negative 88 bp, up from negative 98 bp a week ago. Tapering will start the Fed’s effort to drain liquidity from the system, and excess liquidity has weighted on real and nominal rates all year. There is an end now in sight.
The Treasury yield curve has finished its most recent session with 2s10s at 118, steeper by 4 bp on the week, and 5s30s at 104 bp, unchanged on the week.
The view in spreads
The bullish case for credit and the bearish case for MBS continues. Corporate and structured credit has held spread through most of the year despite the steady approach of Fed tapering. MBS, on the other hand, has widened steadily since the end of May. The difference is likely in the composition in demand across the sectors and in strong corporate fundamentals. The biggest buyers of credit include money managers, international investors and insurers while the only net buyers of MBS during pandemic have been the Fed and banks. Credit buyers continue to have investment demand. Demand from Fed and banks should soften as taper begins, and wider spreads since May arguably anticipate that weaker demand. Once the Fed shows it hand on the timing and pace of taper, the market should be able to fully price the softening in demand and spreads should stabilize.
The view in credit
Credit fundamentals continue to strengthen. Corporations have record earnings, good margins, low multiples of debt to gross profits, low debt service and good liquidity. The consumer balance sheet now shows some of the lowest debt service on record as a percentage of disposal income. That reflects both low rates and government support during pandemic. Rising home prices and rising stock prices have both added to consumer net worth, also now at a record although not equally distributed across households. Consumers are also liquid, with near record amounts of cash in the bank. Strong credit fundamentals may explain some of the relative stable spreads.