


The Big Idea
Inflation Is broadening
Stephen Stanley | October 22, 2021
This document is intended for institutional investors and is not subject to all of the independence and disclosure standards applicable to debt research reports prepared for retail investors.
One of the main Fed arguments for expecting transitory inflation was the narrow run-up in prices earlier this year. In fact, Chair Powell’s Jackson Hole speech in August made this the first of his five arguments for a benign inflation outlook. Unfortunately, the breadth of price pressures has increased substantially in the past few months, adding to the upside risk for inflation. A similar dynamic appears to be occurring with wages as well.
Cleveland Fed CPI measures
The Cleveland Fed publishes two alternative measures of the CPI that try to get at the breadth of inflation. Researchers first rank the components of the CPI based on the magnitude of the monthly increase. Then they parse the data two ways. Accounting for the weights of the components, the Median CPI reports the inflation rate of the component that hits the 50% mark in those ranking. The Trimmed Mean CPI, meanwhile, lops off the components in the bottom 8% and top 8% of the rankings to get rid of outliers.
Comparing the monthly percentage changes in traditional headline and core CPI and the two Cleveland Fed alternatives over the past six months is instructive (Exhibit 1). In April, when the headline and core CPI posted their largest increases, 0.8% and 0.9% respectively, the Cleveland Fed figures came in much lower, at up 0.2% and 0.4% respectively. This wide gap indicates the April surge in prices was driven by just a few categories. In particular, used vehicle prices in April jumped 10.0%, airfares 10.2% and hotel rates 8.8%. A similar pattern occurred in May, when the CPI and core CPI increased by 0.6% and 0.7% respectively, but the Cleveland Fed gauges posted more moderate advances of 0.3% and 0.4% respectively. In May, used vehicles, airfares and hotels were up 7.3%, 7.0% and 0.4% respectively.
Exhibit 1: Monthly changes for various inflation gauges
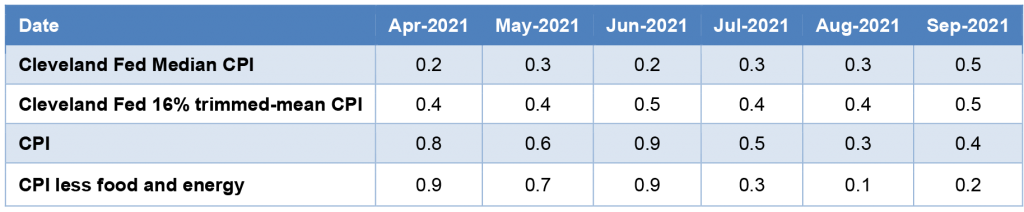
Source: Cleveland Fed, BLS.
By August and September, the comparison had flipped. The headline and core CPI had decelerated substantially. In particular, the core CPI posted quite benign 0.1% and 0.2% advances over the past two months. However, the aggregate was held down by just a few components. In fact, most of the downward impetus came from exactly the same three categories that drove the run-up in the spring. Used vehicle prices slid by 1.5% in August and 0.7% in September. Airfares dropped by 9.1% and 6.4% in those two months, while hotel rates declined by 3.3% and 0.6%. However, even as a handful of categories held down the broad aggregates, the number of line items posting larger gains has increased substantially. The Median and Trimmed-Mean CPI gauges both accelerated to 0.5% gains in September.
The pickup in the Median CPI should be especially disturbing to Chair Powell and the transitory advocates on the FOMC. One can imagine a scenario where the trimmed-mean CPI can still be distorted by a narrowly based pickup in prices. Since the trimming is limited to 8% of the index, it is possible that the top 15% of components by weighting are driving an increase while the remaining 85% are relatively calm. In that example, this particular version of a trimmed-mean index would still be boosted, but the median CPI would not be impacted.
The fact that the median CPI has also accelerated and advanced at something close to a 6% annualized pace in September clearly indicates that upward price pressures have broadened substantially.
Median wages
Turning to wages, the Atlanta Fed publishes unique data that offer a similar look into workers’ pay. The monthly average hourly earnings figures report, as the name would imply, the average for all workers within the sample. As we know, averages can be skewed sharply by outliers. Moreover, the monthly average hourly earnings figures are also subject to compositional shifts. For example, when lower-wage hourly workers were disproportionately laid off during the lockdowns last year, the average hourly earnings spiked, simply because the workers who were still on the job in those months were higher paid—not because the pay of each individual worker was surging.
Exhibit 2: Average hourly earnings
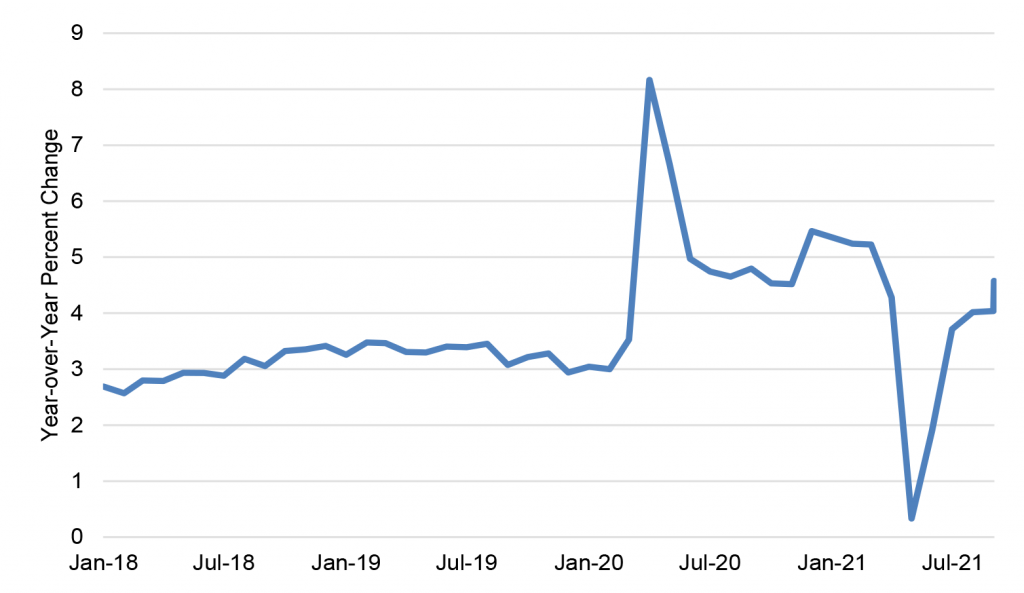
Source: BLS.
Conversely, when employment rebounded sharply last summer, the compositional effects partially unwound, leading to a rapid descent in the year-over-year gains. Note the monthly readings were significantly negative in May, June and July 2020.
This year, the monthly rises in average hourly earnings have been 0.4% or more for the past six months in a row. This occurred even as the bulk of job gains were coming in lower-paid sectors such as leisure and hospitality. In other words, we were seeing sharp increases even as the compositional influence should have been downward. This offers a troubling signal that underlying wage pressures are building in response to a historically tight labor market
The Atlanta Fed wage tracker offers additional evidence that wages are broadly accelerating. The Atlanta Fed gets its wage data from the Bureau of Labor Statistics monthly household survey. Individual respondents rotate into and out of the survey any given month. Respondents will be in four months, out eight months and then in for four months. This pattern allows for a limited number of respondents for which datapoints will be available for the current month and the corresponding year-ago period. There are usually about 2,000 individual responses in each month for which a corresponding year-ago observation exists.
The Atlanta Fed researchers use these 2,000 observations to create year-over-year comparisons. Much like the Case-Shiller and FHFA indices do for home prices, the value of the Atlanta Fed wage tracker is that it is measuring the change in wages for specific individuals. This means the Atlanta Fed database creates truly apples-to-apples comparisons, not subject to compositional shifts.
Then, just as the Cleveland Fed researchers do for the CPI components, the Atlanta Fed economists rank their observations for wage growth and determine the median observation. To clean up some of the volatility in the series, the Atlanta Fed reports the median as a three-month moving average.
The Atlanta Fed wage tracker, much like the Cleveland Fed’s Median CPI, offers insight into what is happening in the middle of the distribution, potentially a far better indicator of the underlying situation than a simple average, which can be distorted by outliers.
Exhibit 3: The Atlanta Fed’s wage growth tracker
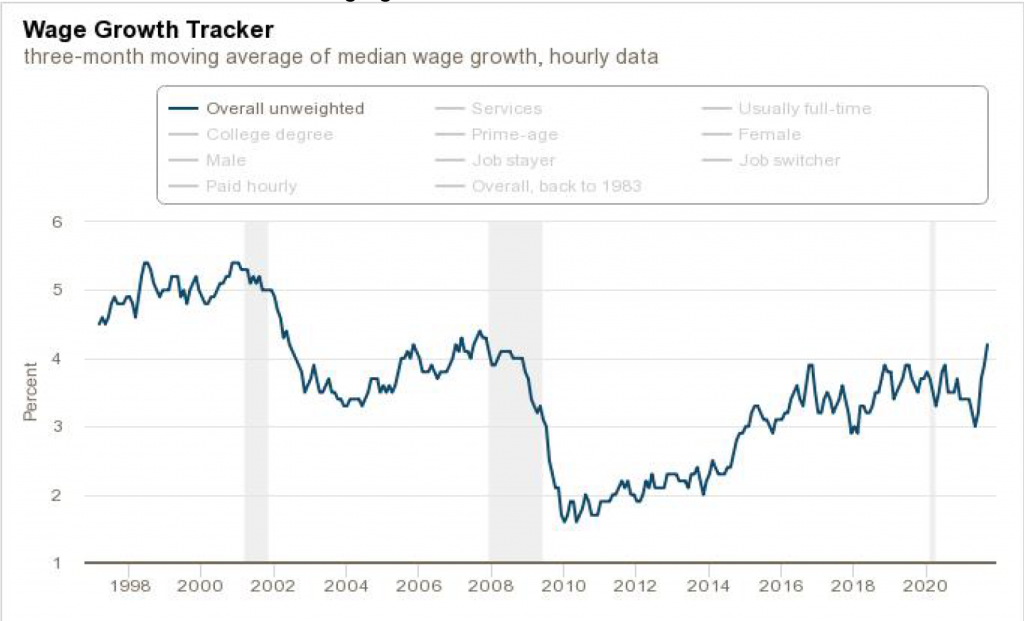
Sources: Current Population Survey, Bureau of Labor Statistics and author’s calculations
The Atlanta Fed’s gauge actually was falling in the second half of 2020 and the early months of 2021, in contrast to the gyrations in the average hourly earnings series (Exhibit 3). However, since bottoming out in May, the measure has rocketed higher over the past several months, reaching 4.2% in September, the highest reading since 2007. This is a compelling signal that underlying wage pressures are significant and broad, sufficient to push the median observation up by more than a full percentage point in only four months.
The Atlanta Fed researchers further break down their dataset. One interesting subdivision that they report is wage changes for job switchers and job stayers. Empirically, we know that the bulk of wage changes tend to occur when workers move to a different job. The Atlanta Fed data confirm that this hypothesis applies to the current situation (Exhibit 4).
Exhibit 4: The Atlanta Fed’s wage growth tracker by job status
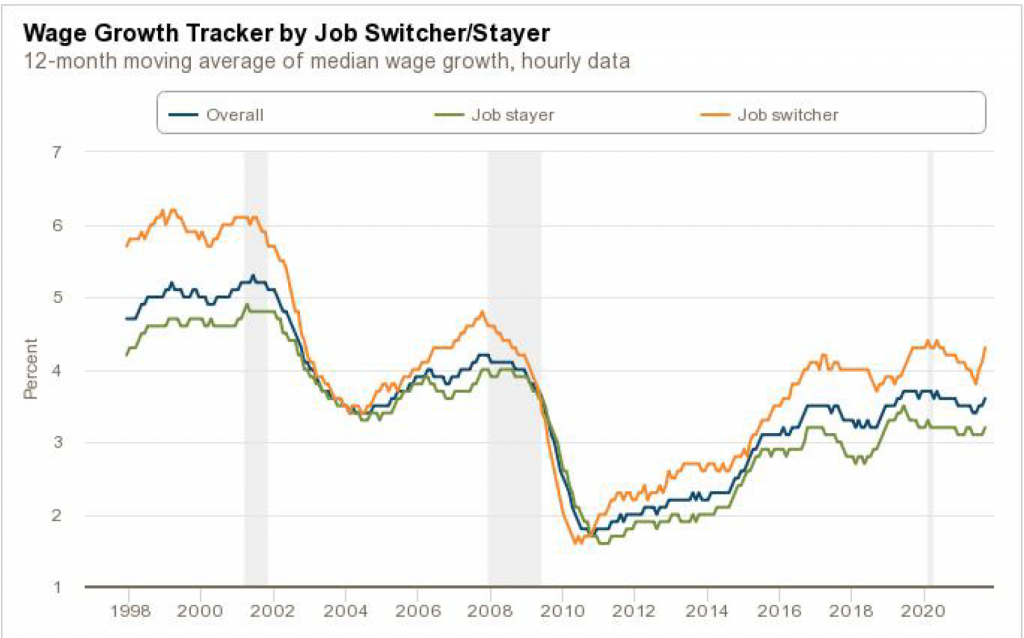
Sources: Current Population Survey, Bureau of Labor Statistics and author’s calculations
The significant rise in wages for job switchers is consistent with a variety of anecdotal and survey evidence about the current labor market situation. The quit rate has surged in recent months, as workers are confident in their ability to leave their current positions for something that either pays better or offers a more amenable work situation. Recent surveys of businesses, in particular the ISM monthly reports and the last few Beige Books, have begun to highlight that worker retention is an increasing problem. Earlier in the year, firms were mostly just having to raise starting wages to bring in reluctant workers off of the sidelines. Now, current workers are driving a hard bargain as well, with people quitting in droves for higher-paying jobs elsewhere as well as a rising prevalence of strikes and strike threats.
Conclusion
The alternative measures of prices and wages, particularly the ones capturing the movement of the medians, offer strong evidence that underlying pressures are building. Fed officials have begrudgingly acknowledged that their transitory narrative will take longer to play out than previously thought, but the risk is that what we are seeing could prove persistent, reflecting important fundamental factors like unprecedentedly easy fiscal and monetary policy, as opposed to simply fleeting supply bottlenecks and one-off price rebounds as the economy reopened. As a number of Fed officials have acknowledged in recent days, the clock is ticking, and they may have to revisit the inflation outlook if prices continue to rise rapidly and in particular in a broad-based manner over the next few months.