


By the Numbers
Negative convexity poised to increase as the Fed tapers
Brian Landy, CFA | October 22, 2021
This document is intended for institutional investors and is not subject to all of the independence and disclosure standards applicable to debt research reports prepared for retail investors.
The Fed is widely expected to fully taper growth in its agency MBS portfolio by the middle of next year, which should increase the negative convexity of MBS purchased by private investors. The Fed has acquired pools throughout QE primarily by buying TBA contracts and taking delivery. These pools typically have the most sensitive prepayment characteristics and the most negative convexity since the seller picks the pools for delivery. The increasing flow of these pools into the TBA float after taper almost certainly will erode the quality of TBA and force private investors to manage more negative convexity.
The Fed primarily buys MBS in the production coupons, which in this latest round of QE have mostly been 2.0% and 2.5% pools (Exhibit 1). The Fed currently owns roughly $640 billion 2.0% pools and $390 billion 2.5% pools. After excluding specified pools and pools locked into CMOs, the Fed owns 56% of the float in 2.0%s and 63% of the float in 2.5%s, The Fed has removed a large amount of MBS with the worst convexity in those coupons.
Exhibit 1. UMBS 30-year, Fed portfolio vs. private holdings
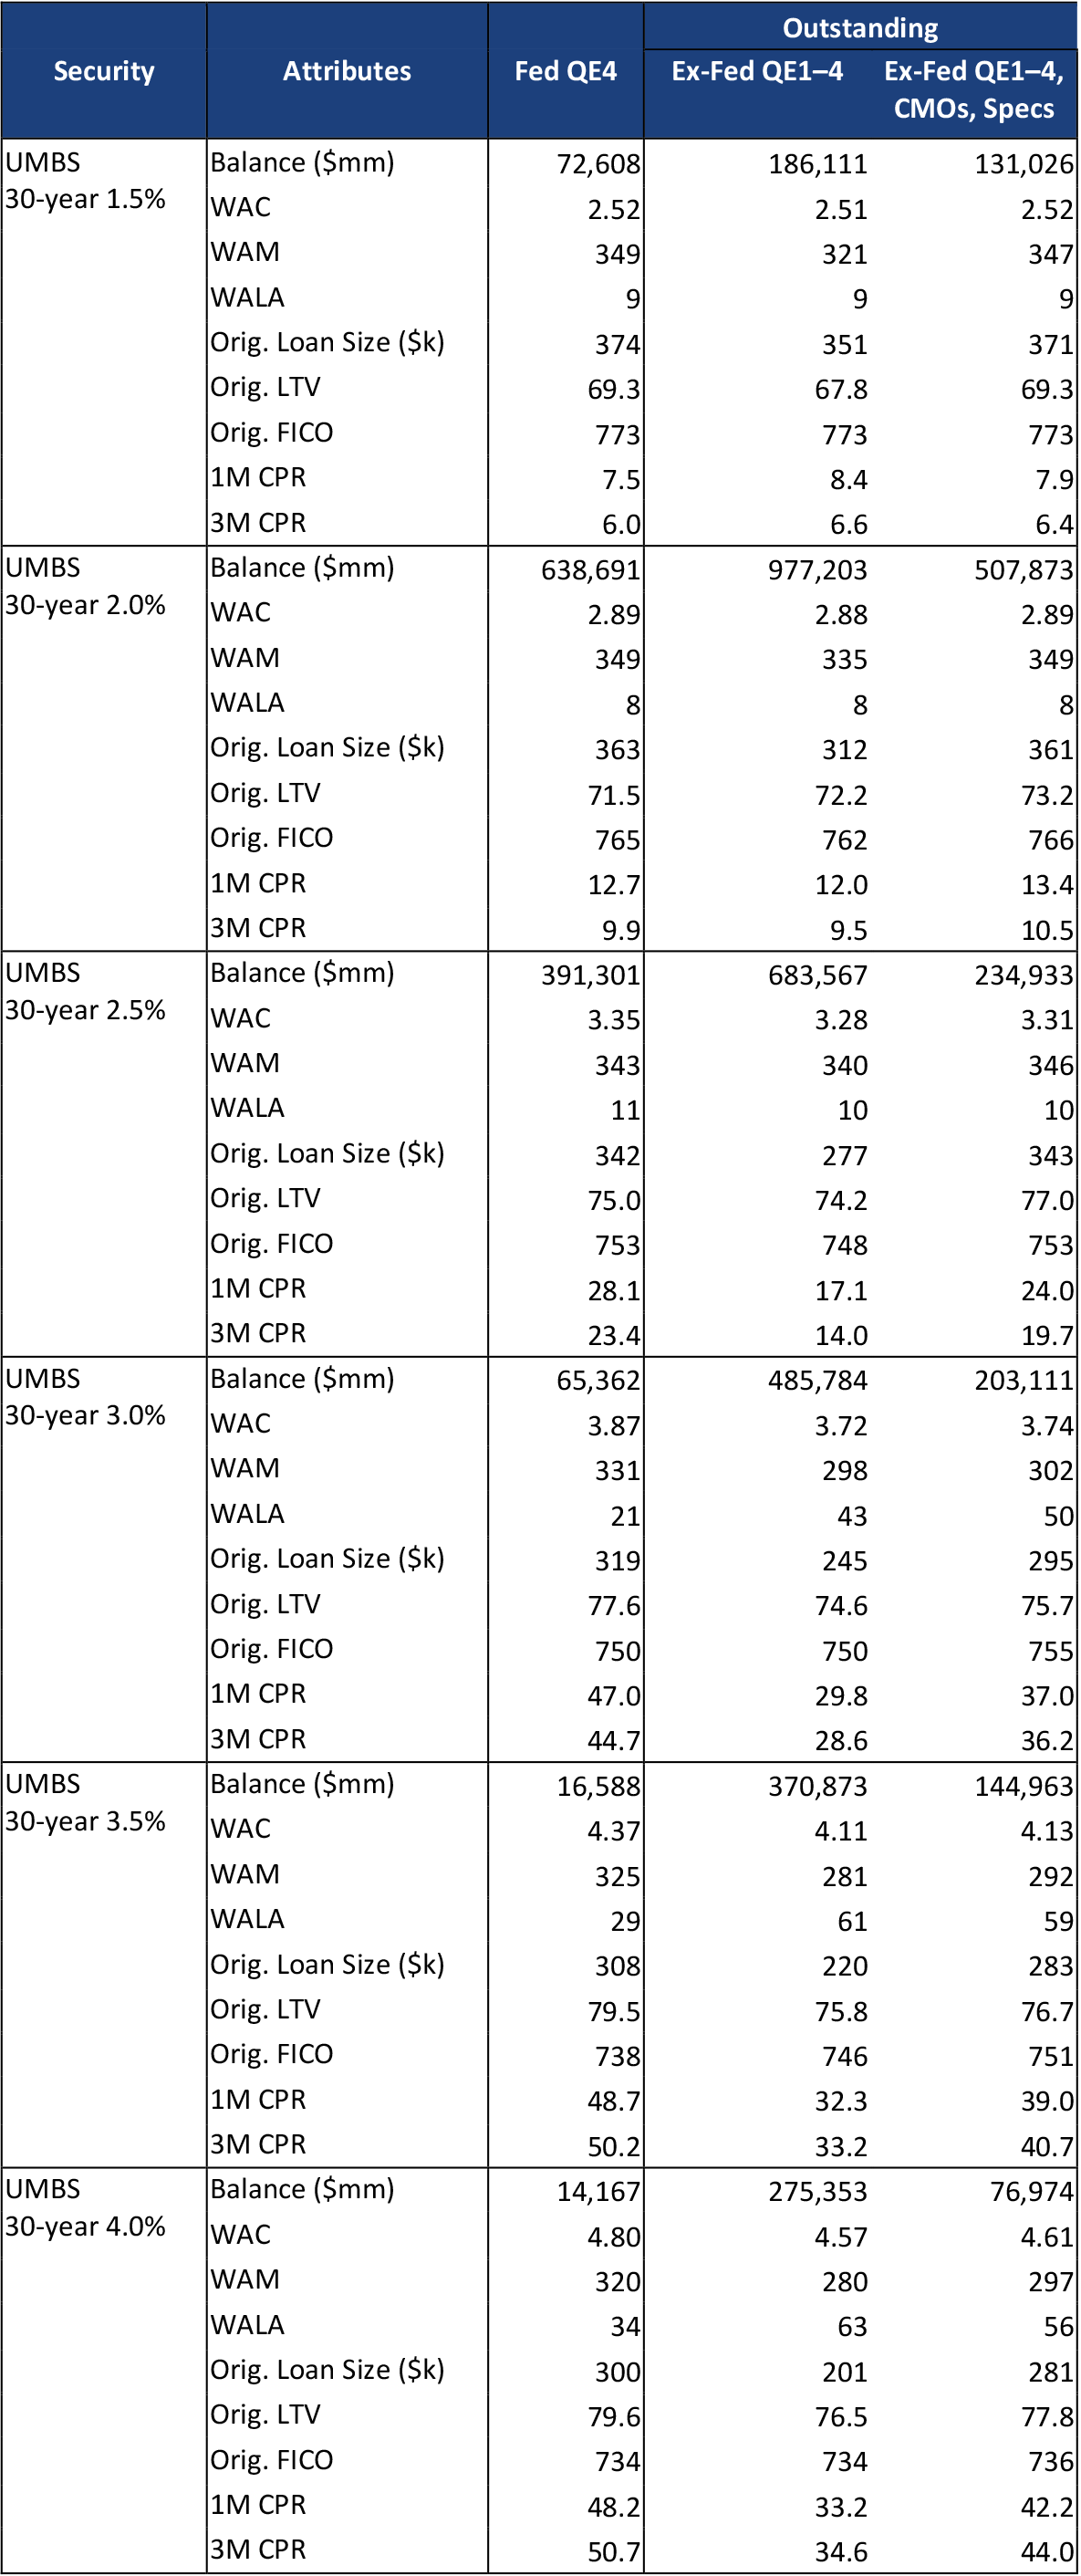
As of October 2021.
Source: Fannie Mae, Freddie Mac, Ginnie Mae, Federal Reserve, eMBS, Amherst Pierpont Securities
Comparing what the Fed owns (“Fed QE4”) to the universe of pools the Fed did not buy (“Ex-Fed QE1–4”) shows that the Fed’s pools are more negatively convex. For example, in the 2.5% coupon, the Fed’s pools have an average original loan size of $342,000 compared to $277,000 for the non-Fed pools. The loan size difference is evident across all coupons. The Fed pools also have a higher credit score in 2.5%s. And in a number of these coupons, the Fed owns pools with higher gross WACs. As a result, the Fed pools are prepaying faster in 2.5% and higher coupons. The speed difference does not show up in the lower two coupons, but this is mostly a function of mortgage rates—those coupons have little recent incentive to refinance.
The final column in the table shows the float—it removes specified pools and pools locked into CMOs. The Fed’s pools look like the float in the coupons that were heavily produced while the Fed was buying. For example, the gross WACs and loan sizes are similar in the 1.5% through 2.5% coupons. But in the 3.0% and higher coupons the Fed took delivery of less seasoned pools with worse characteristics than the float. For example, the Fed’s 3.5% pools are 24 bp higher gross WAC, 30 months less seasoned, and $25,000 larger original loan size than the float in that coupon. And the Fed’s pools have been prepaying faster than the float in all coupons 2.5% and greater.
The picture is similar in Ginnie Mae MBS (Exhibit 2). The pools the Fed owns look very similar to the non-specified pools owned by the private investors. The Fed has bought 40% to 50% of all generic pools in the 2.0% and 2.5% coupons, removing a lot of negative convexity from the market. Few specified pools have been created in the 2.0% coupon so there isn’t much difference between the Fed’s holdings and the float. The Fed’s pools also look like the float in the 2.5% coupon but have a higher loan size than the float. Like conventional 30-year pools, in the 3.0% and higher coupons the Fed took delivery of pools with worse characteristics than the float—higher gross WAC, loan size, and lower seasoning. In all but 2.0%s, the Fed’s pools have prepaid faster than the cohort.
Exhibit 2. GNMA 30-year, Fed portfolio vs. private holdings
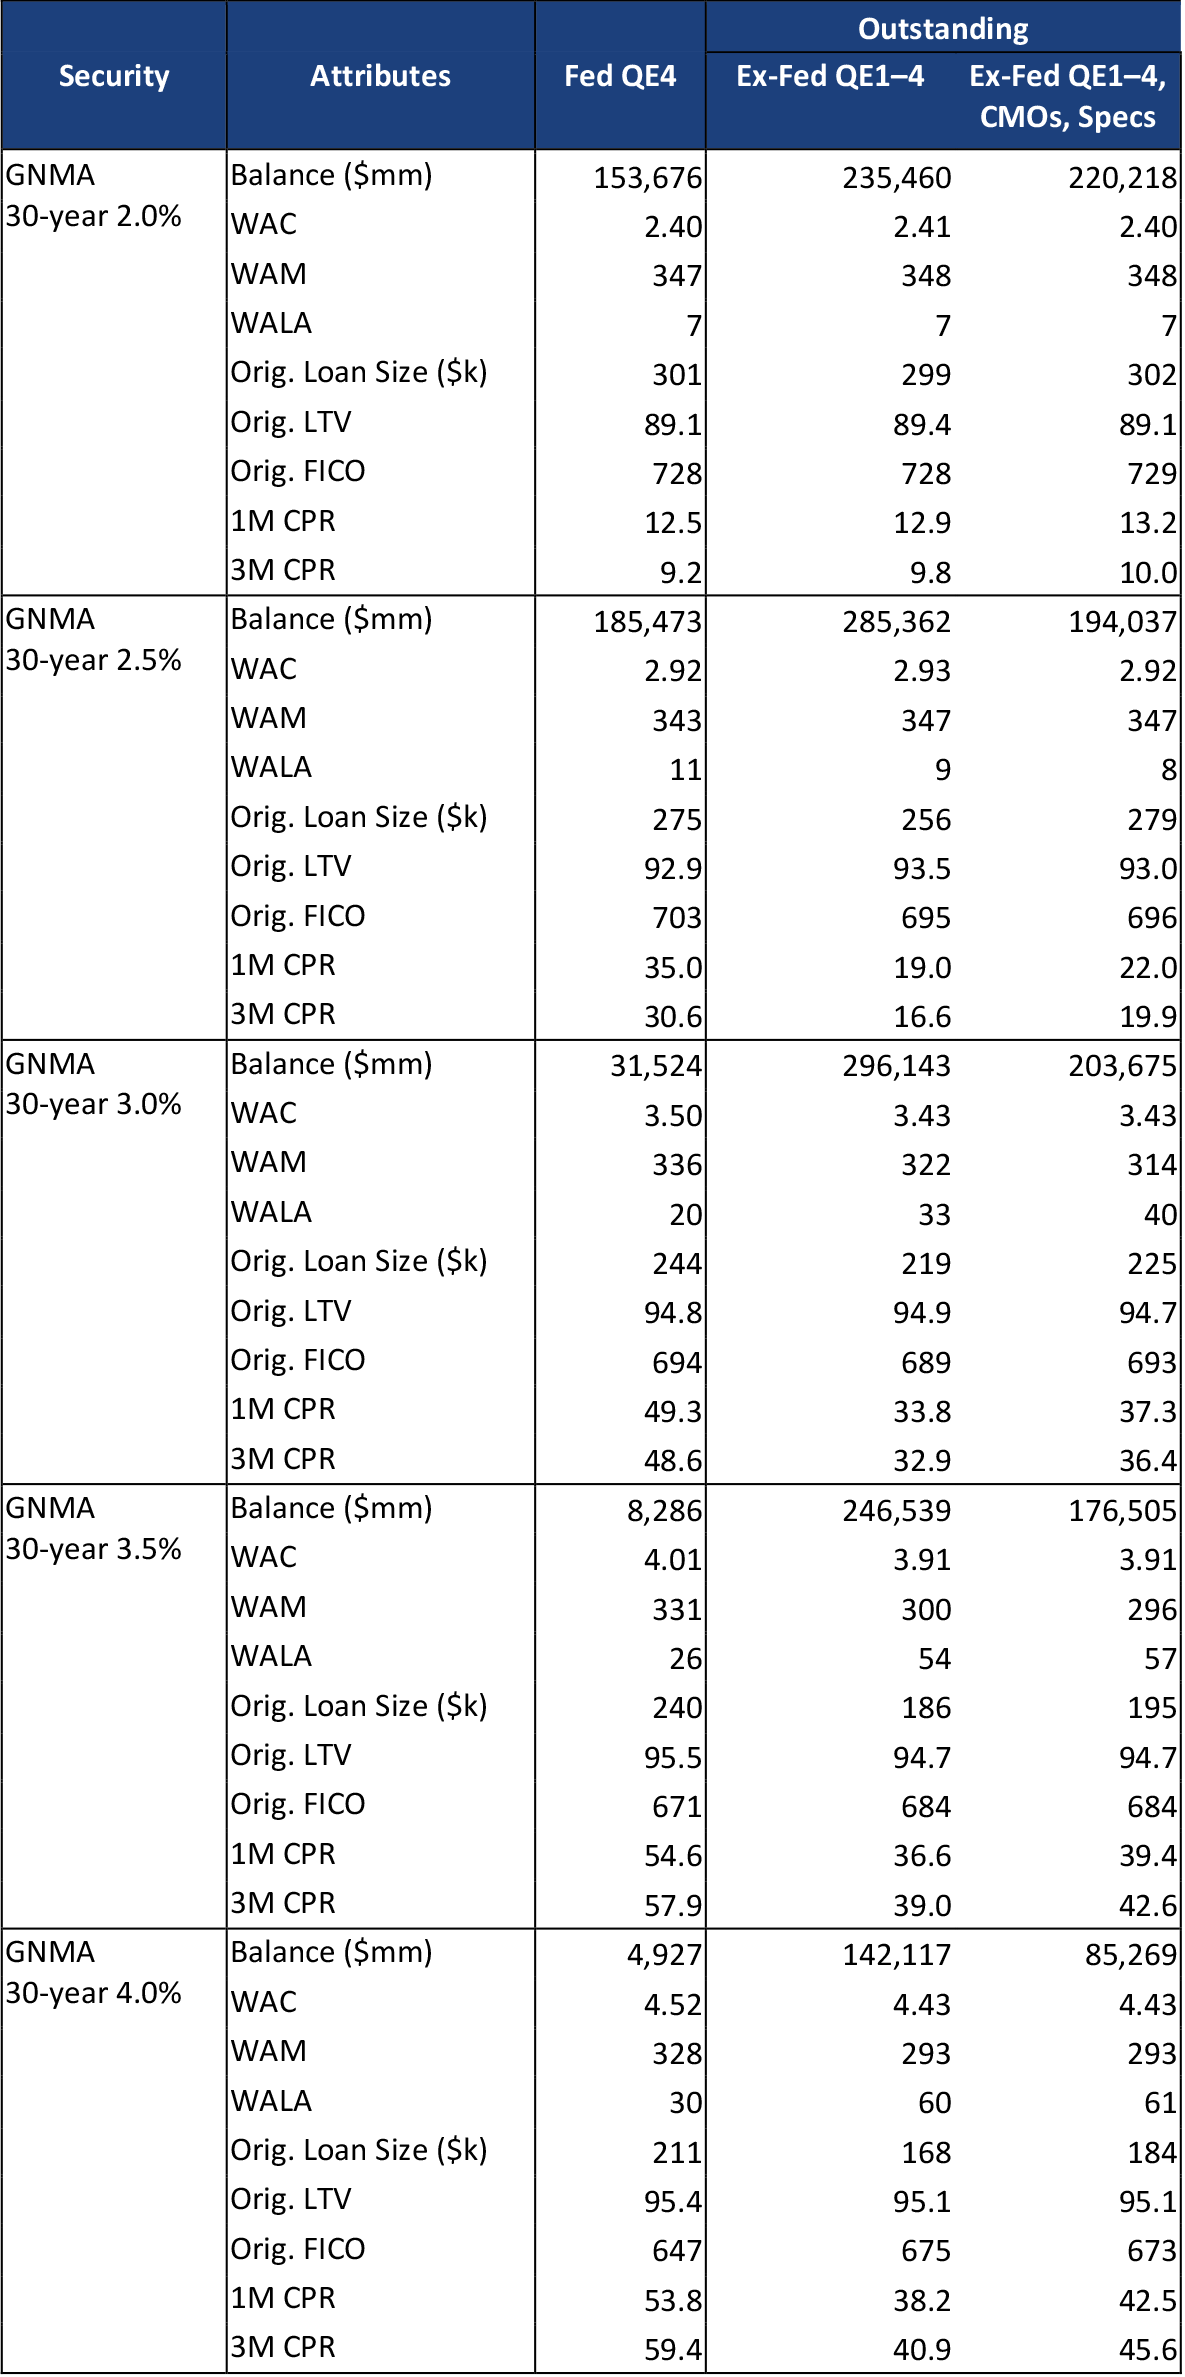
As of October 2021.
Source: Fannie Mae, Freddie Mac, Ginnie Mae, Federal Reserve, eMBS, Amherst Pierpont Securities
The Fed also owns a large share of the generic 15-year UMBS pools issued during the pandemic (Exhibit 3). The Fed owns 53% of generic 1.5%s and 63% of generic 2%s. The Fed pools have similar characteristics as the float, albeit with greater seasoning in the 2% and higher coupons. The Fed’s pools are generally prepaying faster than the float, indicating they have worse convexity that may not be apparent from the collateral characteristics.
Exhibit 3. UMBS 15-year, Fed portfolio vs. private holdings
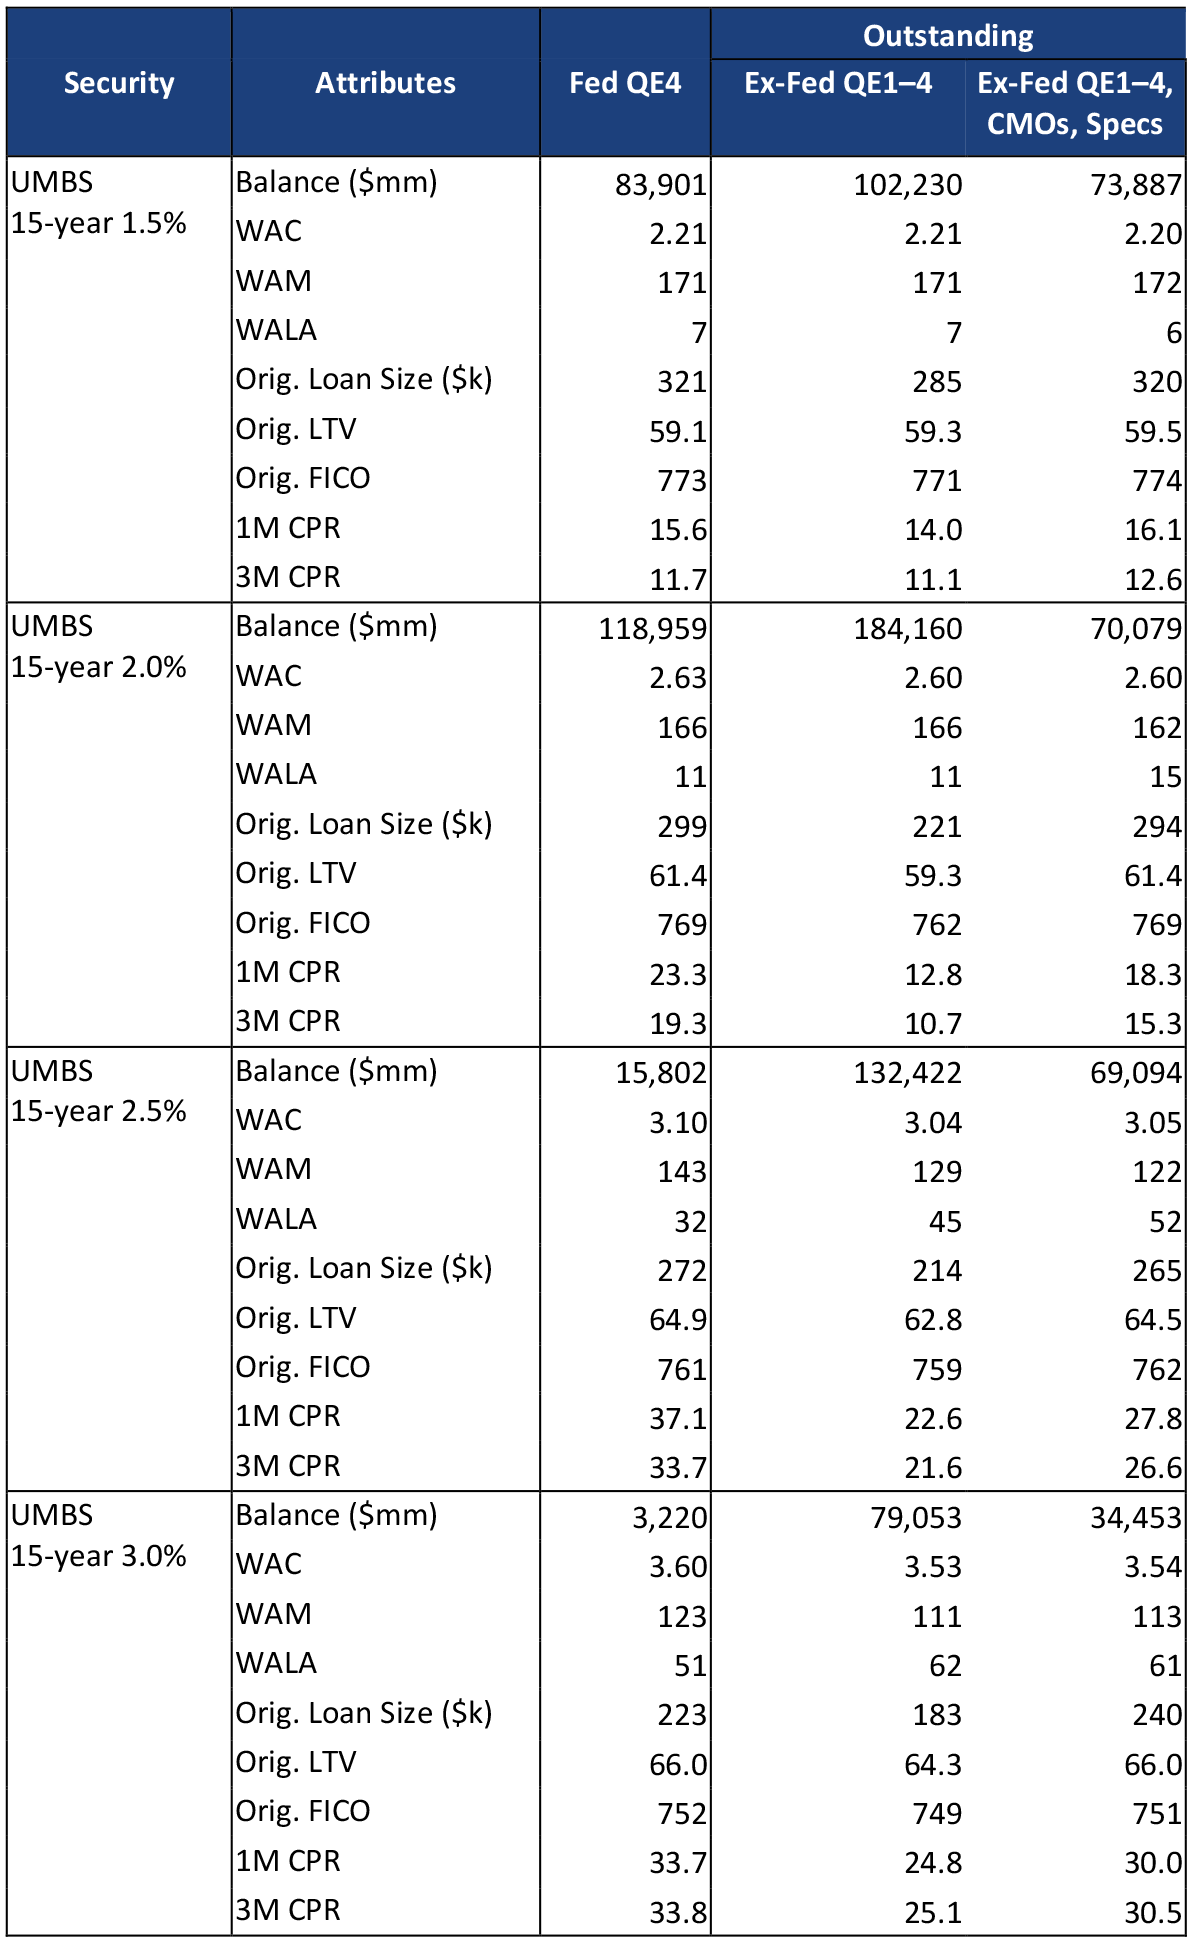
As of October 2021.
Source: Fannie Mae, Freddie Mac, Ginnie Mae, Federal Reserve, eMBS, Amherst Pierpont Securities
It is important to note that the tapering of QE does not mean the end of Fed buying. The Fed will continue to buy to replace any prepayments and amortization and keep its MBS portfolio balance stable. That ongoing buying should continue to filter some of the most negatively convex MBS out of the TBA float. But because the portfolio will no longer be growing, any increase in outstanding agency MBS—through overall growth in mortgage debt or through increased agency loan limits, lower guarantee fees or other things that increase the agency share of mortgage debt—should leave private investors with more negatively convex MBS on their hands.