


The Big Idea
The case for an inverted yield curve
Steven Abrahams | December 10, 2021
This document is intended for institutional investors and is not subject to all of the independence and disclosure standards applicable to debt research reports prepared for retail investors.
The Fed has an inflation fight on its hands, but the path from the latest 6.8% year-over-year CPI back to 2.0% is still unknown. Inflation could fall through natural dampening of price gains, but it also could fall through a Fed campaign to push policy rates above neutral. The path matters. The market for now implies the Fed will win its inflation fight without having to push rates even close to neutral, but that seems unrealistic. The market looks set up to be surprised by an early inversion of the yield curve.
The Fed so far has followed the playbook it laid out at Jackson Hole in 2020 when it sketched plans for flexible average inflation targeting. It has allowed growth to run well above long-run potential, and inflation consequently has run well above the Fed’s 2.0% target. The FOMC in September projected longer run real GDP growth at 1.9%, but growth has far exceeded that mark since the third quarter of 2020. Inflation, of course, has surged and is running well above target (Exhibit 1).
Exhibit 1: The Fed will have to contain high inflation
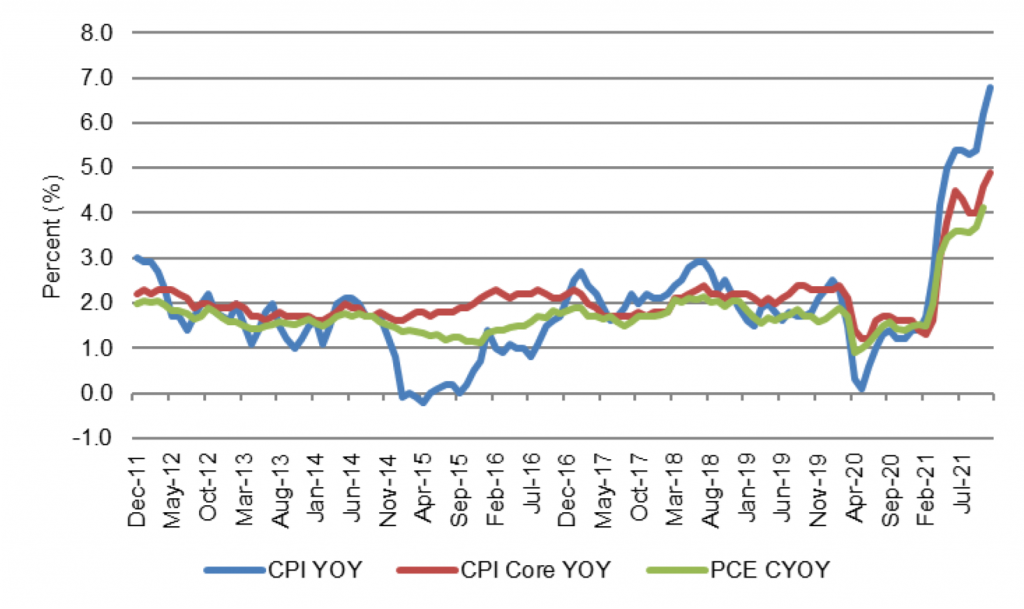
Source: Bloomberg, Amherst Pierpont Securities
Natural dampening of price pressures should help bring down inflation, but there’s a good case that process will need help from the Fed. My colleague and our chief economist Stephen Stanley points out that price pressures have broadened well beyond sectors directly affected by pandemic, such as travel and leisure and hotels. The labor market is tight. And both consumers and corporations have significant spending power that could keep the price of goods and services rising. That does not preclude deceleration of prices through the entry of new sources of supply or the use of less expensive substitutes. But that process on its own could take time.
The market does think inflation eventually will drop. The TIPS market implies a 2-year average inflation rate above 3.0%, but that rate steadily declines at longer maturities to implied a 5-year forward 5-year inflation rate of 2.16%, comfortably near the Fed’s target (Exhibit 2). The issue is how it will drop.
Exhibit 2: The TIPS market see inflation eventually back at 2%
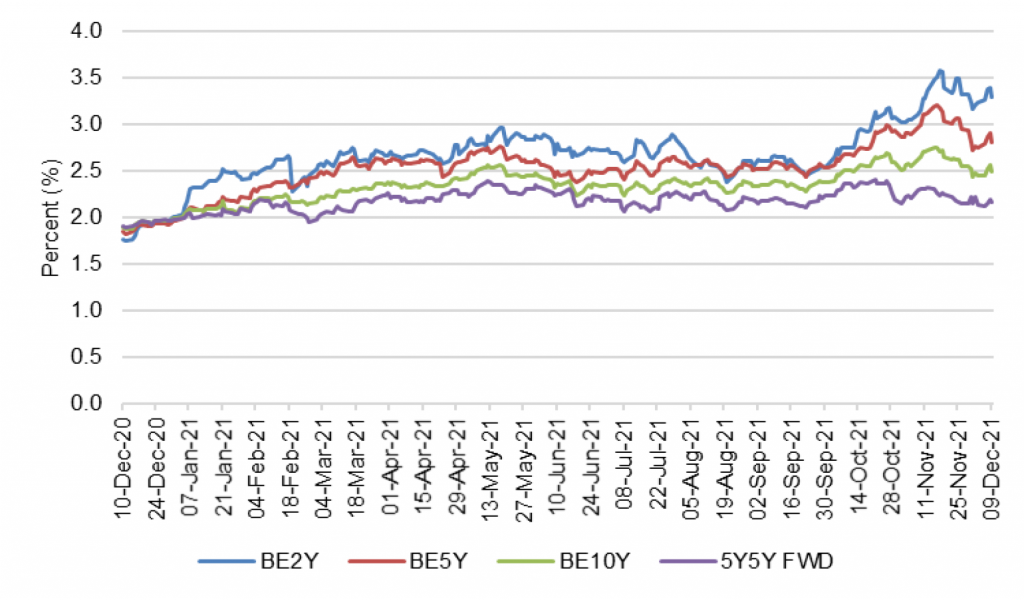
Source: Bloomberg, Amherst Pierpont Securities
As for the Fed’s role in bringing inflation down, the market in overnight index swaps—the market where one party pays a fixed rate and receives the overnight effective fed funds rate—implies the Fed over the next few decades will never push funds above 1.80%. The implied fed funds rate rises above 1.40% by November 2023 and then takes another decade to peak at 1.70% (Exhibit 4). Fed funds futures, although highly illiquid at long maturities, implies a funds rate closer to 2.00% but still below neutral.
Exhibit 3: The OIS market implies fed funds will stay below 1.80%
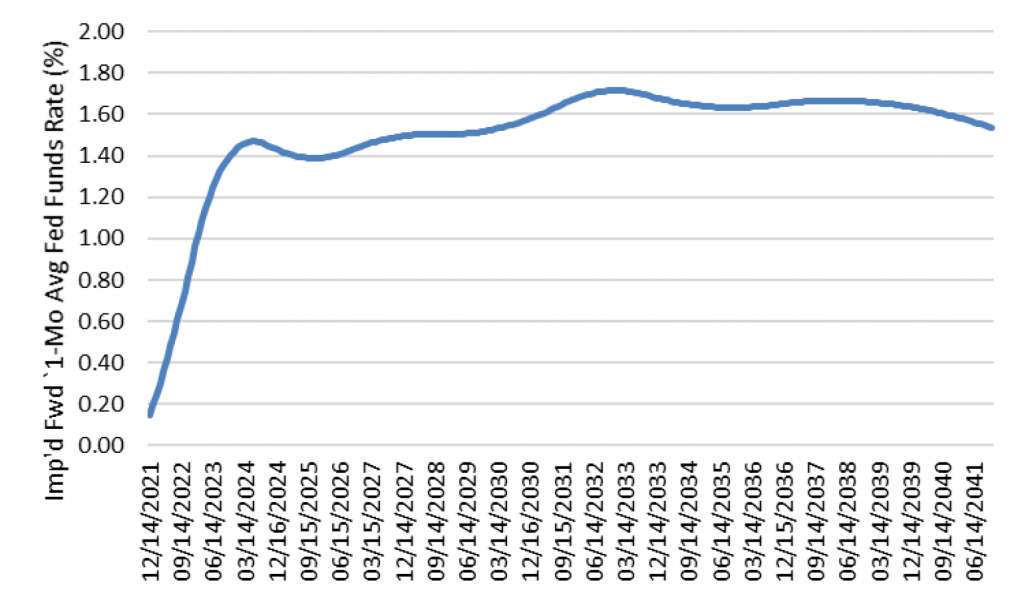
Source: Bloomberg, Amherst Pierpont Securities
The challenge to this implied fed funds path is that the Fed has staked the neutral fed funds rate in its FOMC projections at 2.5%, well above the path implied by OIS and fed funds futures. Unless the Fed revises its view of the neutral rate down substantially, the implied funds path would leave US monetary policy loose for decades. With inflation at current levels and with Powell’s recent congressional testimony suggesting a newly hawkish Fed, decades of loose policy seem very unlikely. Instead, the Fed seems much more likely to push rates closer to neutral and well above current market pricing.
The market for now is not priced for a Fed that has to pull of the gloves in an inflation fight. Implied forward Treasury curves do not invert for the next 10 years, and then only slightly (Exhibit 5). The market is set up to be surprised by early inversion.
Exhibit 4: Forward rates show a flattening but no quick 2s10s or 5s30s inversion
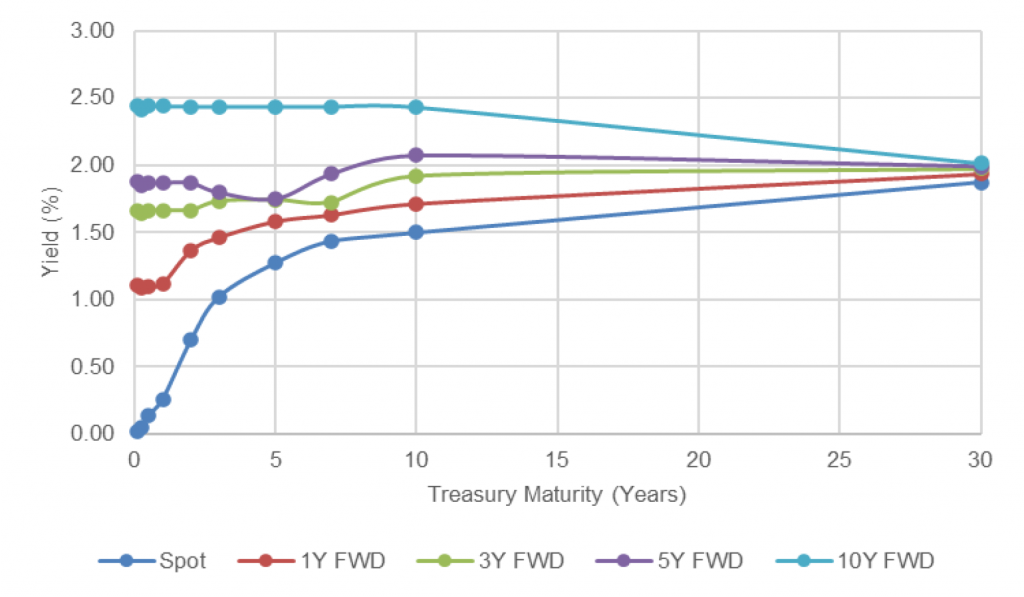
Source: Bloomberg, Amherst Pierpont Securities
Rates investors can capitalize on an underpriced, aggressive Fed path in the spot or forward markets or can put on conditional flattening positions in the options markets. MBS and other investors can tilt key rate durations away from the front of the yield curve or put on barbell positions with floating-rate and long maturity securities to avoid the short and intermediate parts of the yield curve most sensitive to the Fed path. Securities such as inverse IO should trade down sharply if the realized or expected Fed path rises above the current implied one. And asset-liability managers should start exploring the implications of an inverted curve for both sides of the balance sheet.
A year ago, the forward markets underpriced the pace of steepening that came in the first half of this year. The tide has now turned in the other direction.
* * *
The view in rates
The Fed’s RRP facility is closing Friday with balances at $1.507 trillion, at the high end of a narrow range since early October. The facility posted its high mark on September 30 at $1.6 trillion, and with taper starting, the facility has likely seen its peak.
Settings on 3-month LIBOR have closed Friday at 20.088 bp, up more than 2 bp in the last week and hitting its highest level since the end of March. With the LIBOR-to-SOFR transition underway, it is worth noting that SOFR has not moved in months off it’s 5 bp mark, so the LIBOR-to-SOFR spread keeps widening. With a more aggressive taper, deceleration of liquidity and anticipated Fed hikes, yields even at the shortest end of the curve should start to rise.
The 10-year note has finished the most recent session at 1.48%, up 14 bp from a week ago. The 10-year real rate finished the week at negative 100 bp, up 10 bp from a week ago. Despite the rise in real rates, the market continues to price for significant excess liquidity in the future and an economy too slow to generate the borrowing needed to fully absorb it all.
The Treasury yield curve has finished its most recent session with 2s10s at 83 bp and 5s30s at 63 bp, both steeper over the last week.
The view in spreads
All spreads are likely to suffer in the volatility around Omicron and remain soft as volatility likely stays elevated or rises next year. The strands of pandemic, inflation, growth, labor and Fed policy create an unusually wide range of possible outcomes next year and beyond.
Of the major spread markets, corporate and structured credit is likely to outperform. Corporates benefit from strong corporate fundamentals and buyers not tied to Fed policy. The biggest buyers of credit include money managers, international investors and insurers while the only net buyers of MBS during pandemic have been the Fed and banks. Credit buyers continue to have investment demand. Demand from Fed and banks should soften as taper begins, Once the Fed shows it hand on the timing and pace of taper, the market should be able to fully price the softening in Fed and bank demand and spreads should stabilize. But something else is on the horizon.
MBS stands to face a fundamental challenge in the next few months as the market starts to price the impact of higher Fannie Mae and Freddie Mac loan limits. Home prices are tracking toward a nearly 20% year-over-year gain, which should get reflected in new agency loan limits traditionally announced in late November for loan delivered starting January 1. The jump in loans balances should add significant negative convexity to the TBA market and increase net supply. And this will come just as the Fed leans into tapering, which will take out a buyer that often absorbed the most negatively convex pools from TBA and a large share of net supply. The quality of TBA should deteriorate and the supply swell.
The view in credit
Credit fundamentals continue to look strong. Corporations have record earnings, good margins, low multiples of debt to gross profits, low debt service and good liquidity. The consumer balance sheet now shows some of the lowest debt service on record as a percentage of disposal income. That reflects both low rates and government support during pandemic. Rising home prices and rising stock prices have both added to consumer net worth, also now at a record although not equally distributed across households. Consumers are also liquid, with near record amounts of cash in the bank. Strong credit fundamentals may explain some of the relatively stable spreads.