The Big Idea
Shelter costs could confound the Fed
Stephen Stanley | January 28, 2022
This document is intended for institutional investors and is not subject to all of the independence and disclosure standards applicable to debt research reports prepared for retail investors.
CPI measures of shelter costs, rent and owners’ equivalent rent tend to lag measures of home prices by about 18 to 24 months, according to work by the Dallas Fed. Rising home prices since the onset of pandemic should drive up shelter costs for much 2022 and 2023. In fact, the Dallas Fed work predicts shelter costs will ultimately surge to a year-over-year pace around 7%. This run-up has begun, but rent and OER are still only running year-over-year around 3% to 4%. A measure of rents published by Zillow offers an updated read that also suggests shelter costs have far to go this year. That is likely to make it difficult for consumer price inflation to moderate as much as Fed officials hope.
Zillow observed rent index
Zillow collects a variety of housing data, most prominently on home prices from its extensive database. Beginning in 2020, the firm has published its Zillow Observed Rent Index (ZORI). Zillow collects rent information from listings on its site, which has allowed it to collect what it calls an “industry leading database of rental properties.” Like the Federal Housing Finance Agency and S&P CoreLogic Case-Shiller measures of home prices, the ZORI uses a repeated transaction methodology. That is, it looks at rents on the same properties over time to determine the change in rent prices, which avoids issues with compositional changes in Zillow’s listings.
Zillow researchers weight their observations using Census Bureau data on the universe of housing units to make sure that the index offers a fair representation of the overall housing market. Zillow has indices for the 100 largest metropolitan areas in the U.S. and is working on expanding geographic coverage. But the company also publishes a U.S. national index. Unfortunately, the data only go back to 2014, so the history is limited.
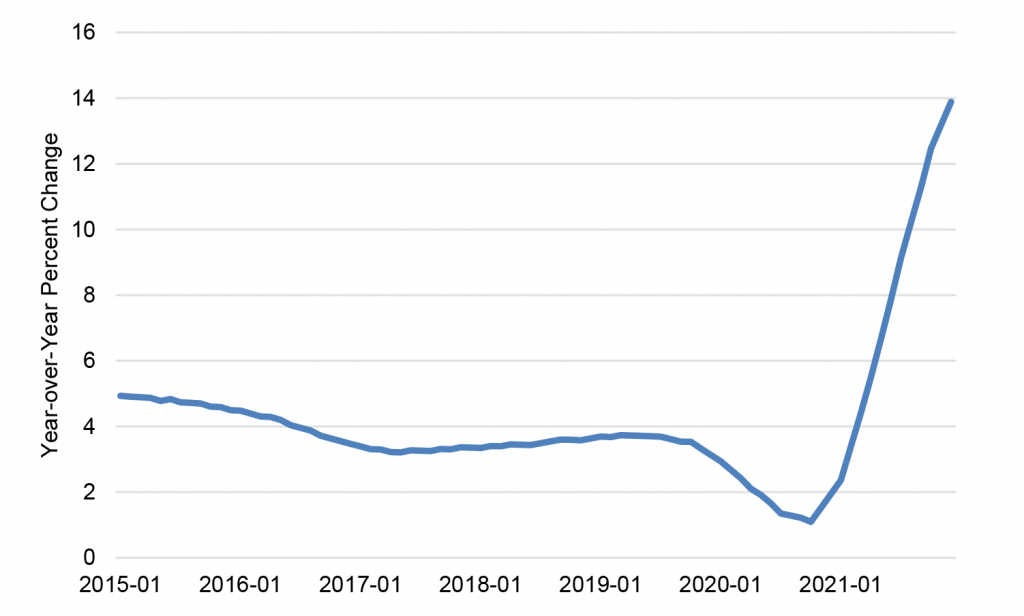
The ZORI ran in the 3%-to-4% range in the years before the pandemic, dipped as low as 1.1% in 2020 due to COVID lockdowns, and has ripped higher since late 2020 (Exhibit 1). The year-over-year advance jumped to 13.9% in December, and the gauge has risen at a 15% annualized pace over the past six months, suggesting that it has not yet peaked.
Exhibit 1: Zillow Observed Rent Index has accelerated in the last year

Source: Zillow.
Mapping ZORI to the CPI
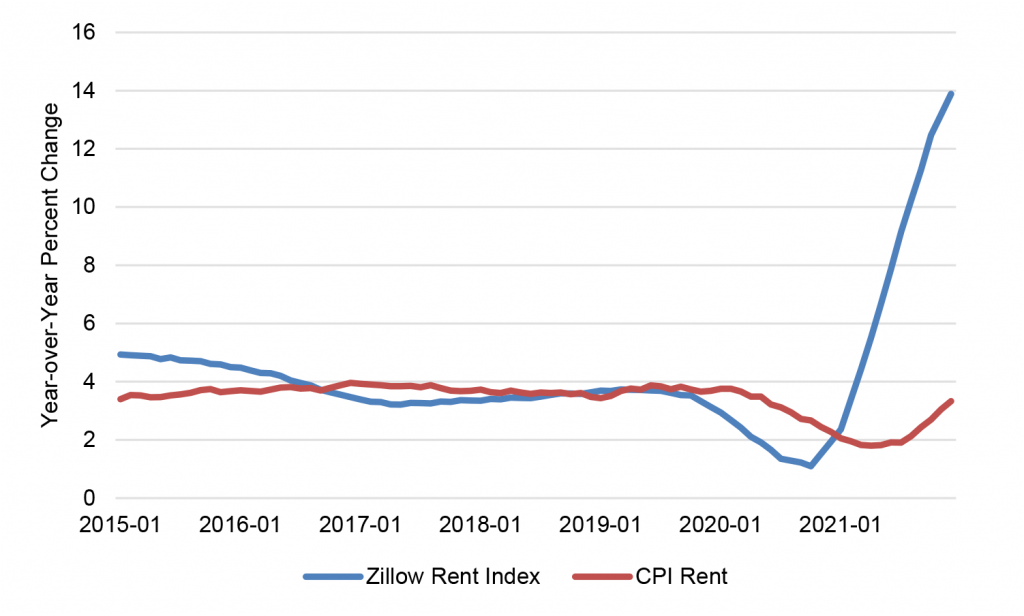
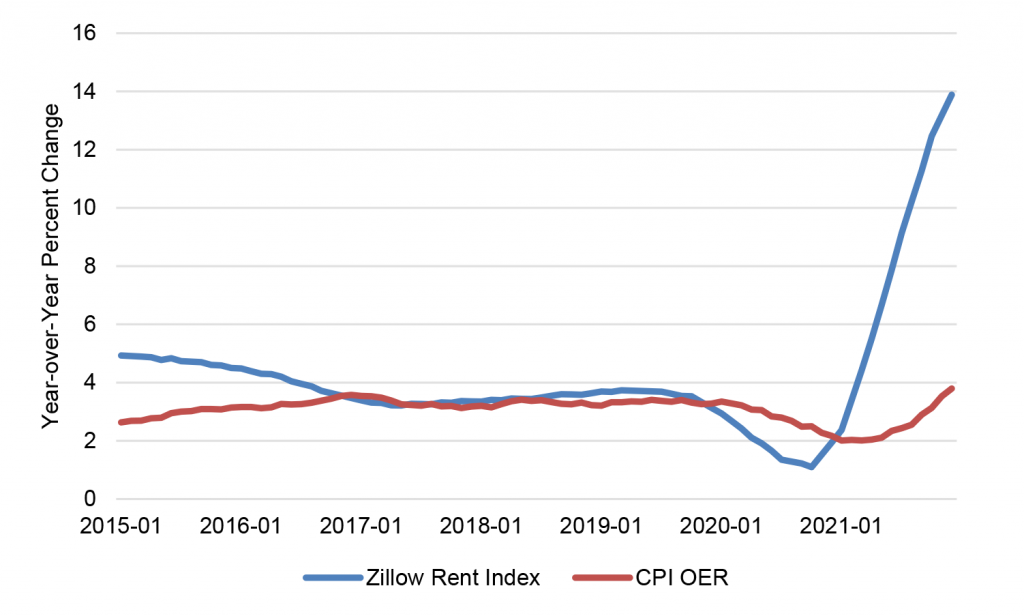
Though there is limited history of the Zillow index, we can look at how movements in the ZORI compare to swings in the CPI measures of rent and OER (Exhibit 2 and Exhibit 3).
Exhibit 2: Zillow Observed Rent Index and CPI rent

Source: Zillow, BLS.
Exhibit 3: Zillow Observed Rent Index and CPI owners’ equivalent rent

Source: Zillow, BLS.
The first feature to compare is the timing of the turns. The year-over-year rise in the ZORI began to decelerate in August 2019 and bottomed out in October 2020 before turning sharply higher. The CPI rent gauge remained steady on a year-over-year basis until the Covid lockdowns in April 2020—eight months behind the ZORI—and bottomed in April 2021—six months behind the ZORI—before turning up in earnest in August. The OER component of the CPI bottomed on a year-over-year basis in March 2020 and turned up significantly beginning in June 2021. The ZORI appears to lead the CPI shelter costs measures, at least in terms of turning points, by around eight months.
As for relative magnitudes, the ZORI gauge decelerated by around 260 bp from the 2019 peak to the late-2020 bottom. By comparison, the CPI gauges of rent and OER moderated by about 190 bp and 130 bp.
On the way back up, the ZORI has exploded at a pace that the CPI gauges are unlikely to replicate. Since beginning to accelerate noticeably last summer, the rent and OER measures have sped up by around 150 bp in about six months. In contrast, the ZORI year-over-year advance picked up by close to 400 bp in the first six months after bottoming out.
Since then, the ZORI has accelerated by another 840 bp, which suggests that the CPI gauges may have at least another 300 bp to go before the end of 2022. That would put rent and OER in the 6% to 7% range by late 2022, not far from where Dallas Fed researchers estimated using a regression against the Zillow home price index, though they had it taking until late 2023 to get there.
In any case, rent and OER represent about 40% of the core CPI and 20% of the core PCE deflator. Focusing on the latter, a 300 bp acceleration in shelter costs in 2022 would add about 60 bp to the year-over-year advance in the core PCE deflator.
To put that into context, if new and used motor vehicles reversed the entire increase seen in 2021 through November—roughly 10% for new vehicles and 40% for used vehicles, which seems like an unrealistically aggressive assumption—it would subtract around 70 bp from the core PCE deflator in 2022. A more realistic assumption for motor vehicles might be for half that much of a decline, and that would only happen if supply constraints were entirely resolved before the end of the year, a prospect that is looking less likely by the day.
The FOMC’s December SEP economic projections call for a deceleration in the core PCE deflator on a Q4-to-Q4 basis of about 200 bp this year. It is hard to see how that can happen if the largest chunk of the core, shelter costs, is accelerating by enough to offset or, more likely, more than offset the clearest candidate driving a slowdown.


