


By the Numbers
Limiting CLO spread risk
Steven Abrahams and Caroline Chen | February 4, 2022
This document is intended for institutional investors and is not subject to all of the independence and disclosure standards applicable to debt research reports prepared for retail investors.
CLOs have finally started widening lately after other risk assets repriced through January to a more aggressive Fed. That has given a bit more urgency to managing spread risk, something notoriously difficult in CLOs. The low correlation of CLO performance to other assets helps diversification but hurts hedging. Moving up in quality might seem like a straightforward solution, but even there the evidence is mixed.
Up-in-quality in any type of credit should cut systematic spread risk. Stronger credit, after all, is less exposed to volatility in revenues, expenses or, for structured credits, collateral performance. As credit risk rises and falls, spreads in stronger credits should move less than spreads in credits more sensitive to ability-to-pay. Spreads in a ‘AAA’ CLO, for example, should move less than spreads in a ‘AA’ class. And as rating class falls, a 1 bp move in a ‘AAA’ class should coincide with a successively bigger move in the weaker class.
That expectation looks broadly true for CLOs. Looking simply at session-to-session changes in spreads on ‘AAA’ and ‘AA’ CLOs over the last five years, a 1 bp move in ‘AAA’ spreads comes with an average 1.05 bp move in ‘AA’ (Exhibit 1). But looking closely at the spread moves, an important part of the result comes from moves of 10 bp or more—either wider or tighter. When ‘AAA’ spreads tighten 10 bp or more, ‘AA’ spreads tend to tighten by a significant multiple. And when ‘AAA’ spreads widen 10 bp or more, ‘AA’ spreads tend to widen by a significant multiple.
Exhibit 1: Especially in big moves, ‘AA’ CLO spreads move more than ‘AAA’
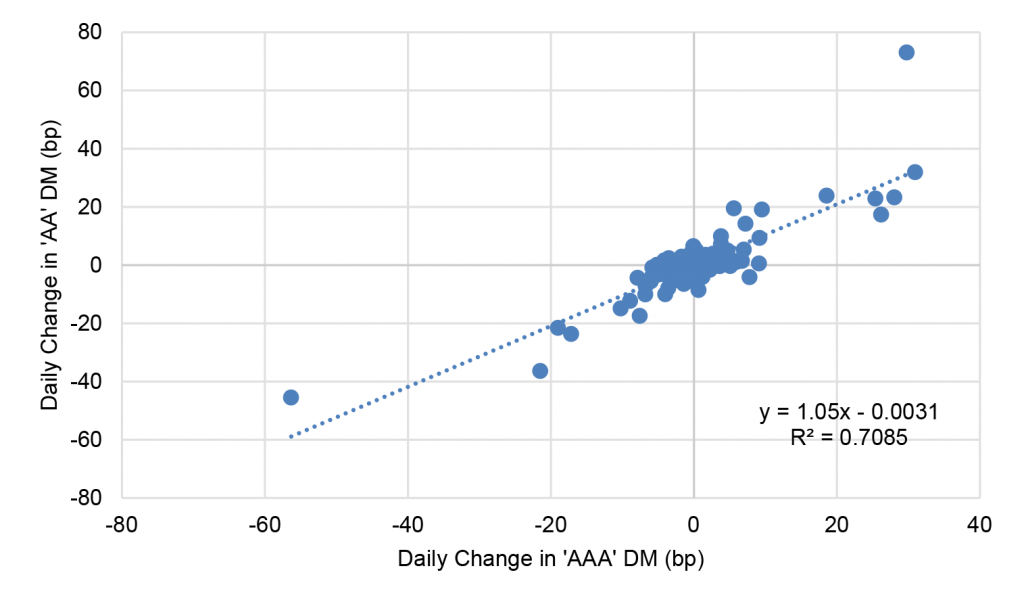
Note: Based on daily change in Palmer Square indices for each rating category from 2/1/2017 to 1/31/2022.
Source: Bloomberg, Amherst Pierpont Securities.
The relationship between ‘AAA’ and ‘AA’ CLO spreads also is inconsistent over time. Breaking spread moves down into calendar year groups, the move in ‘AA’ spreads for a 1 bp move in ‘AAA’ varies from 0.42 in 2018 to 1.08 in 2020 (Exhibit 2). Of course, 2020 brought the biggest spread moves in recent history, which is consistent with the observation that differences in spread sensitivity are most pronounced in volatile markets. But the inconsistency over time suggests there is a lot of noise or idiosyncrasy in the spreads. In 2020, with big swings in credit expectations, systematic risk became a bigger part of day-to-day spread moves and the expected relationship between ‘AAA’ and ‘AA’ spreads shows up.
Exhibit 2: Inconsistency in the relationship between ‘AAA’ and ‘AA’ spreads
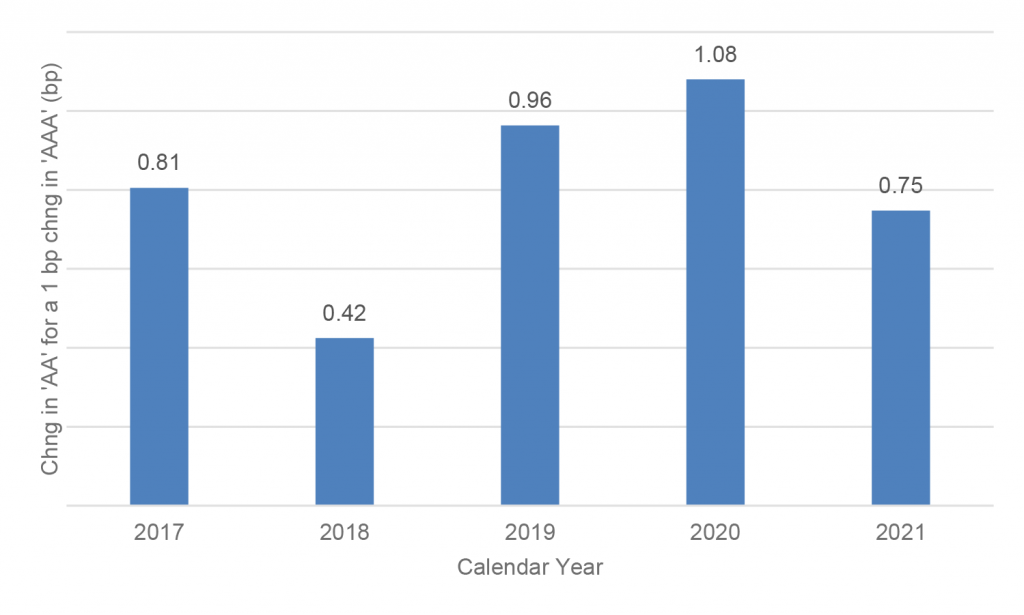
Note: Based on daily change in Palmer Square indices for each rating category from 2/1/2017 to 1/31/2022.
Source: Bloomberg, Amherst Pierpont Securities.
Looking at the changes in spread in lower rating classes for a 1 bp change in ‘AAA’ roughly shows rising spread exposure in the weaker classes. A 1 bp move in ‘AAA’ coincides with an average 1.05 bp move in ‘AA’, as noted before. For ‘A’, the move is a surprising 0.96 bp. For ‘BBB’, a more expected move of 1.93 bp. And for ‘BB’, a move of 2.37 bp. The results suggest a 1 bp move in ‘AAA’ CLO spreads coincides with roughly the same magnitude of move in ‘AA’ and ‘A’ classes. Only in ‘BBB’ and ‘BB’ classes does a 1 bp move in ‘AAA’ coincide with an expected much bigger move in the weaker class.
Exhibit 3: A 1 bp ‘AAA’ spread move coincides with bigger moves in ‘BBB’, ‘BB’
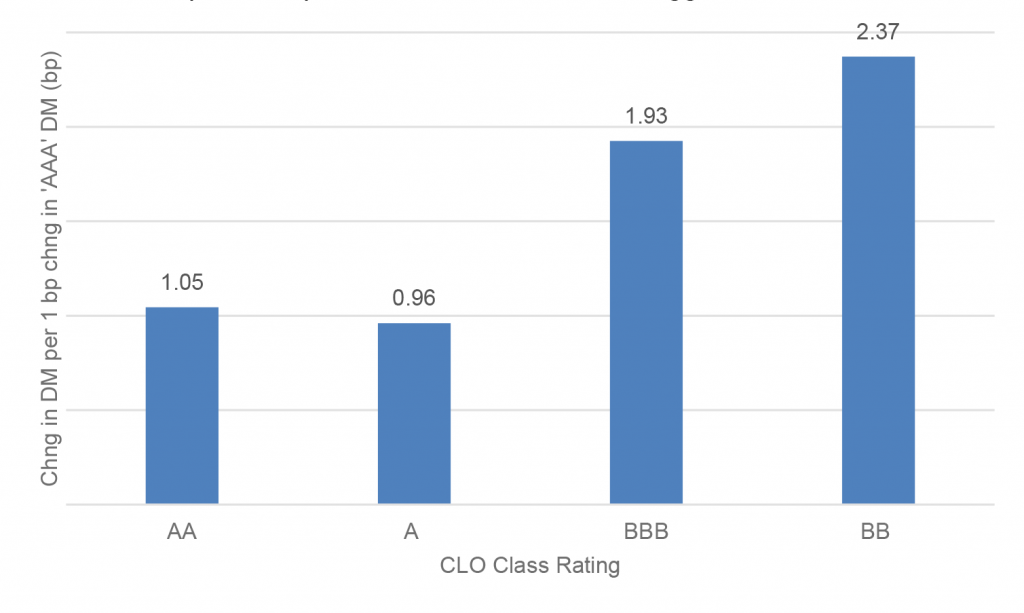
Note: Based on daily change in Palmer Square indices for each rating category from 2/1/2017 to 1/31/2022.
Source: Bloomberg, Amherst Pierpont Securities.
Even though a 1 bp shift in ‘AAA’ CLO spreads should coincide with steadily larger shifts in subordinate classes as rating falls, the evidence over the last five years is mixed. The simplest explanation for this result is the illiquidity of CLO debt and the resulting idiosyncrasy in spreads. Noise in the spreads masks the expected systematic relationship between rating classes.
Going up-in-quality above an ‘A’ rating may not help in normal markets. It has a better chance of helping in volatile markets. Going up-in-quality also may help if the move is from ‘BBB’ or ‘BB’ into a more highly rated class.
CLO investors do have other ways of reducing spread exposure, especially by shifting into seasoned debt with a shorter weighted average life. An important caveat is to target seasoned debt trading below par, if possible. Debt trading at or above par has extension risk, especially if spreads widen and eliminate deal incentives to refinance. And that would work against the very effort to limit weighted average life and spread duration.