


The Big Idea
Managing a bearish market
Steven Abrahams | February 4, 2022
This document is intended for institutional investors and is not subject to all of the independence and disclosure standards applicable to debt research reports prepared for retail investors.
At this point in the early stages of Fed tightening, the curve has flattened and spreads in almost all risk assets have widened. More looks likely. The Fed has signaled it wants plenty of flexibility to rein in inflation and could easily use it. Playing defense in debt markets invariably gives up current income in hopes of better performance later. There are no easy choices, but some look better than others.
Positioning for a flatter curve
Forward rates imply the yield curve will flatten over the next six months and beyond, but of the most common ways of putting on a flattening trade—2s10s or 5s30s—the longer tenors look like better value. Both trades give up carry, so the outcome depends on rates and pricing.
In the 2s10s trade, forward rates imply yields rise on the 2-year note over the next six months from 1.32% to 1.67% and on the 10-year note from 1.93% to 2.05% (Exhibit 1). A duration-neutral trade that sells the 2-year note and buys the 10-year note nets a small loss if rates follow the forwards. To make money, 2-year yields have to go up more than forward rates or 10-year yields have to go up less.
Exhibit 1: Results from flattening trades if rates follow 6-month forwards
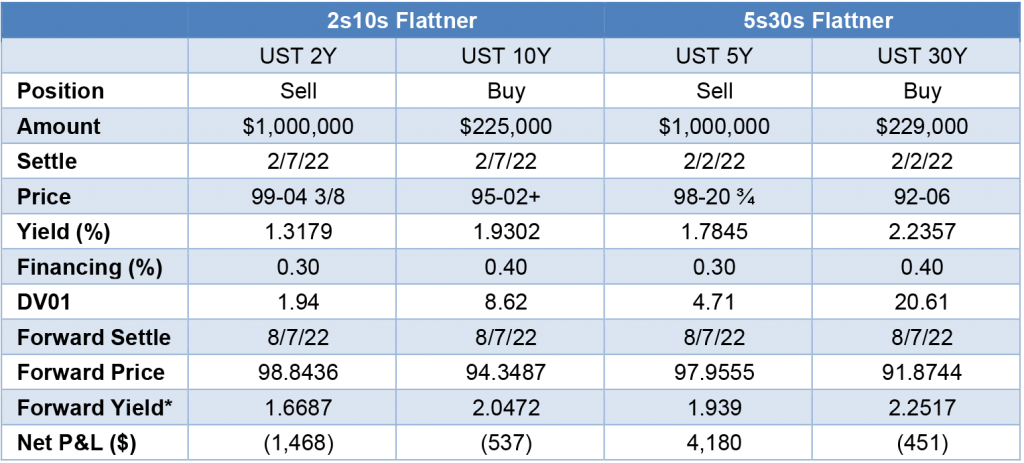
Note: forward yields adjusted for shorter maturity of each issue at the 6-month horizon. All levels as of 3p 2/4/22.
Source: Bloomberg, Amherst Pierpont Securities.
The prospects for the 5s30s trade look better. Forward rates imply the 5-year yield in the next six months rises from 1.78% to 1.94%. For 30-year yields, forwards imply a rise from 2.24% to 2.25%–barely any move at all. If forwards materialize, the 5s30s trade nets a small profit. A more aggressive repricing of the 5-year note looks likely, and movement in the 30-year looks similarly unlikely. The Fed dots already imply a more aggressive Fed through 2024 than the market has priced, and any persistence in inflation will likely push market pricing toward the Fed rather than the other way around. The 30-year bond, on the other hand, is less sensitive to current Fed policy and more sensitive to expected real rates and inflation. There is some chance real rates could rise a bit more, but inflation expectations look well grounded.
Positioning for wider spreads in credit
Beyond rates, the incremental risk in credit comes from spreads. Here, the best defensive plays look like going up-in-quality in longer maturities.
Corporate fundamentals look strong, with inflation so far seeming to push up revenues faster than costs and leaving many companies with record profits. But costs should catch up with revenues eventually and bring profits and margins back to more normal levels. Besides the prospects of normalizing fundamentals, spreads in MBS look likely to go wider, and credit cannot trade in its own bubble.
The traditional way to manage credit spread risk is to shorten maturity, go up-in-quality or do both. The gains from going up-in-quality are straightforward: stronger, typically less leveraged balance sheets are less sensitive to the volatility of revenues, costs and margin. As credit risk goes up and down, spreads on stronger credits should move less, and that is clear in the behavior of credit spreads. For every move of 1 bp in the spreads on the strongest ‘AAA’ corporate balance sheets, spreads in weaker credits move more. The weaker the credit, the bigger the move. Over the last five years, for example, a 1 bp move in ‘AAA’ spreads has come with a 1.1 bp move in ‘AA’, a 1.5 bp move in ‘A’, a 2.5 bp move in ‘BBB’, a 4.2 bp move in ‘BB’ and a 6.8 bp move in ‘B’ (Exhibit 2). Moving up-in-quality can significantly cut spread risk.
Exhibit 2: Moving up-in-quality in corporate debt cuts spread risk
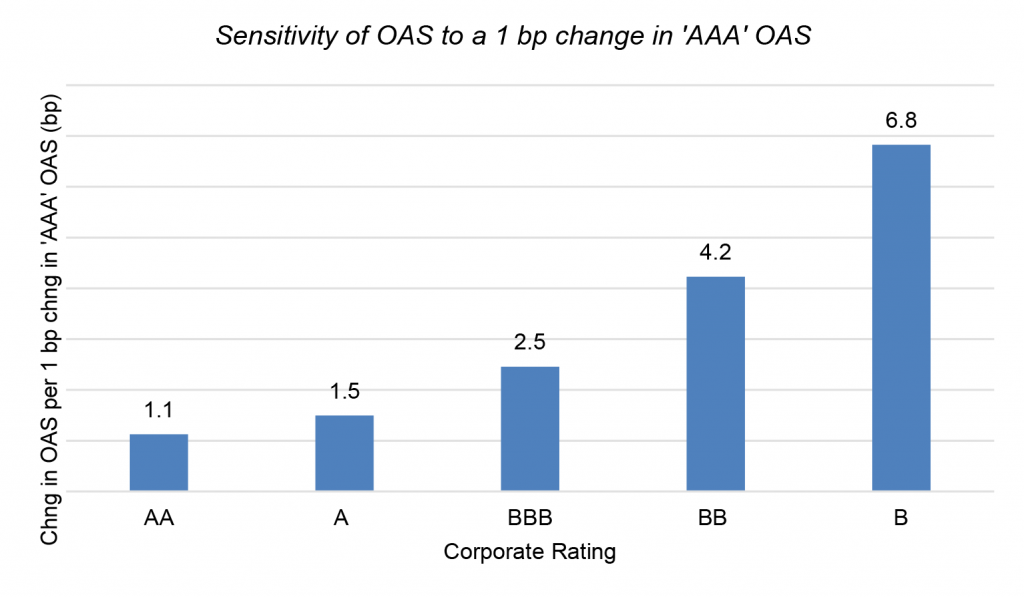
Note: based on option-adjusted spreads in the ICE BofAML US Corporate Option-Adjusted Spread indices available from the Federal Reserve Bank of St. Louis. Results from regressing session-to-session changes in each rating OAS on session-to-session changes in ‘AAA’ OAS.
Source: FRED, Amherst Pierpont Securities.
With longer rates less subject to repricing the Fed but with longer credits carrying substantial spread duration, going up-in-quality on the longer end of the credit curve seems like the most efficient way to cut spread exposure. Since any concerns about weakening credit are likely to steepen the spread term curve, going up-in-quality in longer tenors is likely to have added benefit.
Moving up-in-quality also works broadly in CLOs, where spreads on lower-rated debt also move more for every 1 bp widening in ‘AAA’. But the patterns in CLOs are noisier and more reliable in more volatile markets or in big moves up-in-quality. Investors probably get more reliable results in CLOs by finding positions with relatively short weighted average lives and trading below par.
Positioning for wider spreads in MBS
In MBS, going into higher coupons trims spread duration, and the approach has worked well so far this year. As my colleague, Brian Landy, pointed out lately, higher coupons in both 30- and 15-year conventional and Ginnie Mae MBS printed positive excess returns as spreads widened in January while lower coupons lost money after hedging duration. Dollar roll financing in higher coupons has also turned special lately, adding to potential returns.
There are other strategies for countering potential widening in 15-year MBS, which have richened in recent months as banks and the Fed have bought more than the available net supply. Adding 20-year pools looks like one reasonable alternative and adding hybrid ARMs looks like another. Both alternatives give up carry against a 15-year position but should perform better with modest widening or shifts in rates.
Moving up-in-coupon in MBS invariably moves portfolio duration around, so any move will require offsetting shift in interest rate exposure to rebalance net portfolio exposure.
Fed policy right now has obviously pivoted from a focus on labor to a focus on inflation, and predicting the path of inflation is a difficult art—something the Fed acknowledges. The Fed may have to recalibrate its path over the next six months until it can start to see the impact of tighter policy on inflation. Rate hikes and renormalization of balance sheet can eventually bring down inflation, but it may not be pretty. Until the path of inflation and Fed policy are clearer, the market looks bearish. But once both are clear, a healthy appetite for risk should come right back.
* * *
The view in rates
The FOMC on January 26 left open the door to tightening faster than the 2015-2018 cycle, and that could involve a hike of 50 bp at some point. The market since the FOMC has repriced to more than five hikes by the end of 2022, so it apparently takes the possibility seriously.
The Fed’s RRP facility is closing Friday with balances near $1.642 trillion, toward the higher end of the range so far this year. With the RRP facility paying 5 bp, which is often better than repo rates lately, it is getting heavy action. RRP balances could also rise if bank deposit rates lag the rise in fed funds and other wholesale rates. Deposits could flow to money market funds and into RRP. It is notable that total bank liabilities have flattened out this year, so balances may already be flowing to funds and into RRP.
Settings on 3-month LIBOR have closed Friday at 31 bp, up a basis point on the week. Setting on 3-month SOFR have drifted up to 26 bp.
The 10-year note has finished the most recent session at 1.91%, up 14 bp on the week. The 10-year real rate finished the week at negative 50 bp, up 19 bp on the week. A more aggressive Fed would start balance sheet normalization earlier, with portfolio runoff taking cash out of the market. That should lift real rates.
The Treasury yield curve has finished its most recent session with 2s10s at 60 bp, flatter by only 1 bp on the week, and 5s30s at 44 bp, flatter by 2 bp on the week. The curve should continue to flatten.
The view in spreads
Spreads generally look vulnerable while the Fed is calibrating policy to inflation. Of the major spread markets, corporate and structured credit is likely to outperform, as it has since March 2020. Corporates benefit from strong corporate fundamentals and from buyers not tied to Fed policy. The biggest buyers of credit include money managers, international investors and insurers while the only net buyers of MBS during pandemic have been the Fed and banks. Credit buyers continue to have investment demand.
MBS faces pressure as the Fed considers a quick start to runoff. My colleague Brian Landy projects that new supply of MBS will run at $60 billion a month. He also estimates the Fed will need to allow runoff in MBS of more than $30 billion a month. Without the Fed or banks to take up an average of $90 billion in incremental supply, the burden would likely fall on mutual funds. Mutual funds do not have the capital to fully take up the slack.
MBS also faces pressure from new, higher loan limits on Fannie Mae and Freddie Mac MBS. Higher balances bring more negative convexity. Fed taper also reduces the amount of negatively convex loans filtered out of the TBA floating supply. The quality of TBA should erode this year, and spreads widen with it.
The view in credit
Credit fundamentals continue to look strong. Corporations have record earnings, good margins, low multiples of debt to gross profits, low debt service and good liquidity. It will be important to watch inflation and see if costs begin to catch up with revenues. The consumer balance sheet now shows some of the lowest debt service on record as a percentage of disposal income. That reflects both low rates and government support during pandemic. Rising home prices and rising stock prices have both added to consumer net worth, also now at a record although not equally distributed across households. Consumers are also liquid, with near record amounts of cash in the bank. Strong credit fundamentals may explain some of the relatively stable spreads.