


The Big Idea
Connecting the dots
Steven Abrahams | March 18, 2022
This document is intended for institutional investors and is not subject to all of the independence and disclosure standards applicable to debt research reports prepared for retail investors.
Besides sketching an expected path for fed funds, the big shifts in the Fed dots last Wednesday had big lessons for the markets: that the path of inflation in the short run is highly uncertain, that the Fed intends to tighten beyond its goldilocks neutral rate and that the neutral rate may be coming down. That last lesson may be the most underappreciated and the most important for the rates market. It points to an increasing view that potential growth has dropped and that longer rates should stay low. There is a plausible case for that and for a steady path toward yield curve inversion.
Last Wednesday unveiled a tectonic shift in Fed consensus since December. The median fed funds rate at the end of 2022 jumped by 100 bp, by the end of 2023 by 112.5 bp and by the end of 2024 by 62.5 bp (Exhibit 1). And the median longer-term rate, the goldilocks rate that covers the cost of inflation and leaves the supply and demand for money in balance, fell 12.5 bp
Exhibit 1: Fed consensus on fed funds has shifted sharply since December
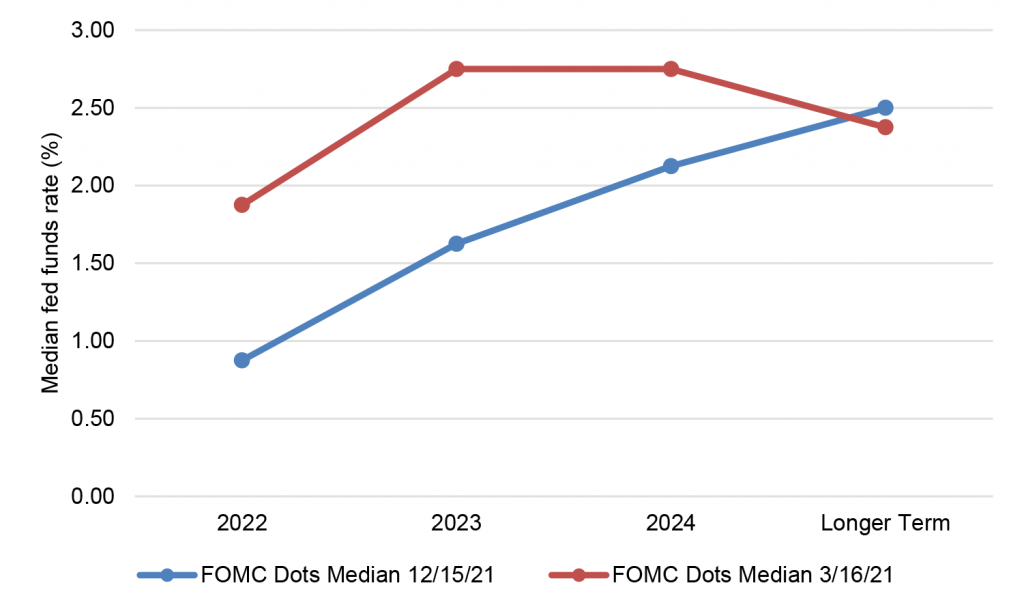
Source: Federal Reserve, Bloomberg, Amherst Pierpont Securities
It’s tough to make predictions, especially about inflation
The shift in consensus for the end of 2022 showed again that it’s tough to make predictions, especially about the future and particularly about inflation. Investors should expect inflation will continue to confound easy prediction and the Fed at some point will recalibrate again. From 2008 through 2015, the Fed launched QE and kept the target funds rate near zero without getting inflation reliably above 2%. In 2020, it shifted to flexible average inflation targeting, planning to let the labor market tighten without preemptively raising rates and comfortable letting inflation temporarily run above target. Little did the Fed know that vaccines would mitigate the worst possibilities of pandemic and fiscal stimulus would leave households and corporations flush. Too much household and corporate money is now chasing too few goods, made scarce by pandemic supply bottlenecks and low workforce participation. The Russia-Ukraine conflict has only only made supply frictions greater and promises to keep goods scarcer for longer. The longer Russia-Ukraine continues, the greater the likelihood that inflation persists and the Fed will have to go further than even the latest dots suggest.
The Fed no longer wants to be neutral
The shift in consensus for the end of 2023 put median fed funds at 2.75%, above the previous 2.50% rate that the Fed considered neutral. While it seemed likely the Fed would go above neutral even before the December FOMC, the Fed did not play that card until Wednesday. By playing that card, the Fed signals it is willing to raise costs of borrowing, take cash out of the economy through QT and reduce spending to levels that will slow the economy. That is arguably the Fed’s only choice for taming inflation. Some of its own affiliated staff research argues the Fed can do little about the bottlenecks and supply inefficiencies creating the shortfall in goods, so the only choice is to reduce demand. In the long run, that should help keep inflation expectations anchored, which arguably is the Fed’s most important job. But rate hikes and QT and blunt instruments, and the path to lower inflation may not be smooth.
Neutral rates may have slipped lower, and longer rates with them
Finally, the shift in consensus for longer rates to 2.375% continues a 10-year trend of steady Fed revisions to a lower neutral rate. A decade ago, the rate stood at 4.25% (Exhibit 2). Although the causes of the steady revisions lower are many, it is tempting to pin the latest revision in part on an accelerating trend away from global trade, something that makes the global economy less efficient and potential growth lower. Many countries have done a poor job managing job losses and other bad outcomes from globalization, and political appetite has waned. The trend picked up speed in recent years with rising tariffs and other barriers to movement of goods and people. The Russia-Ukraine conflict is only likely to accelerate the trend. In a recent Foreign Affairs essay, Adam Posen argues that Russia-Ukraine has transformed supply chains and financial networks into national security issues. The rewinding of globalization, he argues, is likely to encourage redundancies, reduce competition and limit innovation. With less growth and less demand to borrow, real rates should fall.
Exhibit 2: The FOMC’s median longer-term rate has dropped for 10 years
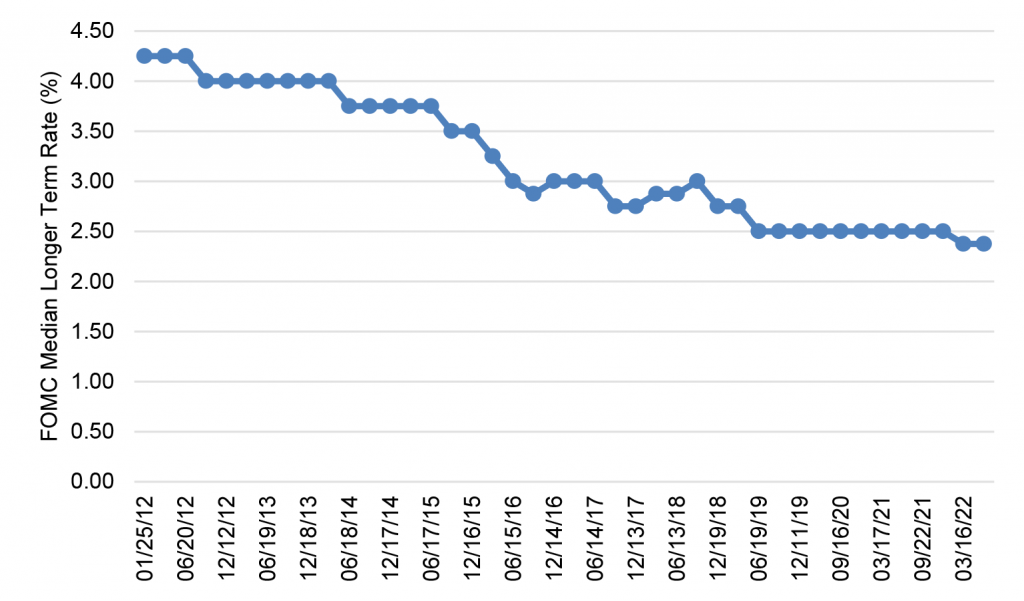
Source: Federal Reserve, Bloomberg, Amherst Pierpont Securities
Connecting the dots from last Wednesday points to a yield curve likely to invert much more than implied by forward rates. Forward rates already imply the yield spread between 10- and 2-year Treasury rates will drop from a current positive 21 bp to negative 25 bp over the next year (Exhibit 3) Still, the risks of persistent inflation are high, the Fed has signaled willingness to broadly lower demand and fair value for the long end of the curve should stay between 2.0% and 2.5%.
Exhibit 3: Forward rates imply the 2s10s curve will invert over the next year
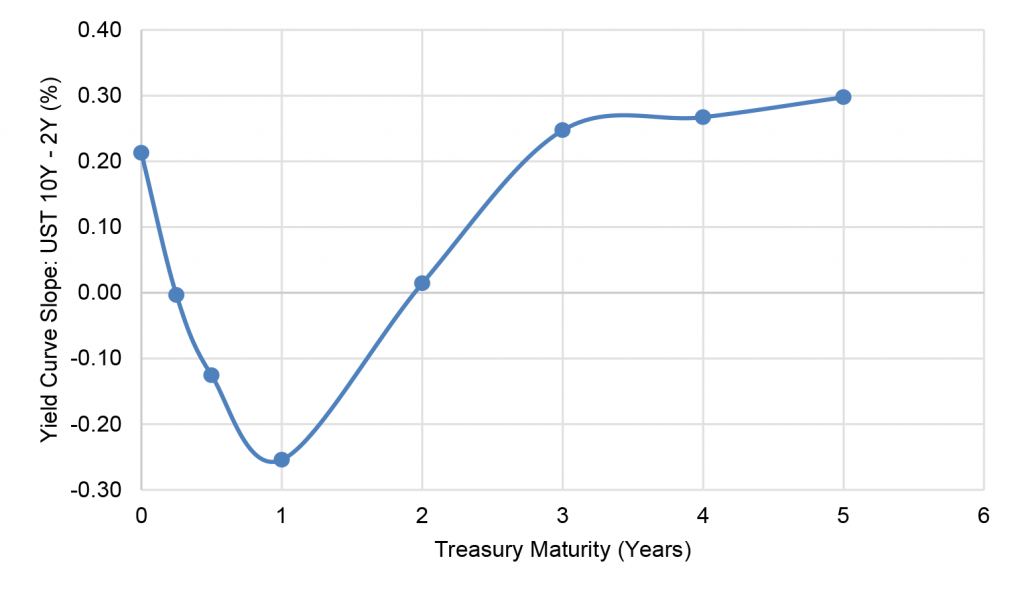
Source: Federal Reserve, Bloomberg, Amherst Pierpont Securities
“Still seas do not make skilled sailors,” one trader told me this week. It looks like the market is in the process of minting a new generation of skilled sailors.
* * *
The view in rates
The Fed’s RRP balances have jumped by more than $100 billion in the two days since the FOMC, closing Friday at $1.71 trillion, near the high point of the year. The RRP rate on Wednesday rose from 5 bp to 30 bp, and the race is on to see if banks raise rates to defend their deposit base or let deposits flow into money market funds and on to the RRP. So far, the flows suggest money market funds are picking up balances, and time will tell whether comes is at the expense of banks. If so, it could weaken bank demand for Treasury debt and MBS.
Settings on 3-month LIBOR have closed Friday at 92 bp, up 12 bp in the last week. Setting on 3-month SOFR have drifted up to 52 bp, up only 5 bp in the last week. The spread between 3-month LIBOR and SOFR continues to widen as the market adds to the premium for taking risk.
The 10-year note has finished the most recent session at 2.15%, up 16 bp in a week. Breakeven 10-year inflation finished the week at 290 bp, down 7 bp on the week. The inflation markets apparently liked the hawkish Fed. The 10-year real rate finished the week at negative 75 bp, up 23 bp from a week ago. Real rates dropped sharply as Russia invaded Ukraine, reflecting new, significant concern about whether growth will be sufficient to absorb future liquidity, but they have rebounded from those lows.
The Treasury yield curve has finished its most recent session with 2s10s at 21 bp, flatter by 3 bp in the last week, and 5s30s at 28 bp, flatter by 13 bp over the last two weeks.
The view in spreads
The recent FOMC has taken some risk out of the market but Russia-Ukraine remains. Even after the hot phase of Russia-Ukraine ends, there is considerable uncertainty about stability in Russia and Ukraine in the long run. Of the major spread markets, corporate and structured credit is likely to outperform, as it has generally since March 2020. Corporates benefit from strong corporate fundamentals and from buyers not tied to Fed policy. The biggest buyers of credit include money managers, international investors and insurers while the only net buyers of MBS during pandemic have been the Fed and banks. Credit buyers continue to have investment demand, but insurers are likely to take an increasingly strong hand in setting prices.
MBS faces new pressure as the Fed looks likely to start runoff in May. My colleague Brian Landy projects that new supply of MBS will run at $60 billion a month. He also estimates the Fed will need to allow runoff in MBS of more than $30 billion a month. Without the Fed or banks to take up an average of $90 billion in incremental supply, the burden would likely fall on mutual funds. Mutual funds do not have the capital to fully take up the slack.
MBS also faces pressure from new, higher loan limits on Fannie Mae and Freddie Mac MBS. Higher balances bring more negative convexity. Fed taper also reduces the amount of negatively convex loans filtered out of the TBA floating supply. The quality of TBA should erode this year, and spreads widen with it.
The view in credit
Credit fundamentals look strong for now but will almost certainly soften later this year as the Fed dampens demand. Russia-Ukraine should have limited direct impact on either the US corporate or consumer balance sheet. Corporations have strong earnings, good margins, low multiples of debt to gross profits, low debt service and good liquidity. It will be important to watch inflation and see if costs begin to catch up with revenues. A higher real cost of funds would start to eat away at highly leveraged balance sheets with weak or volatile revenues. Consumer balance sheets look strong with rising income, substantial savings and big gains in real estate and investment portfolios. Homeowner equity jumped by $3.5 trillion in 2021, and mortgage delinquencies have dropped to a record low.