


The Big Idea
Supply and demand for debt show vulnerabilities
Steven Abrahams | March 25, 2022
This document is intended for institutional investors and is not subject to all of the independence and disclosure standards applicable to debt research reports prepared for retail investors.
The Fed and banks last year made up 94% of net demand for agency debt and MBS, 51% of net demand for Treasury debt and 23% of net demand for corporate and structured credit and foreign bonds. Both supply and demand across these markets are about to pivot, and market pricing has started to reflect it. Still, for agency debt and MBS, it looks like the most challenging market for clearing supply and demand in sector history.
Debt supply
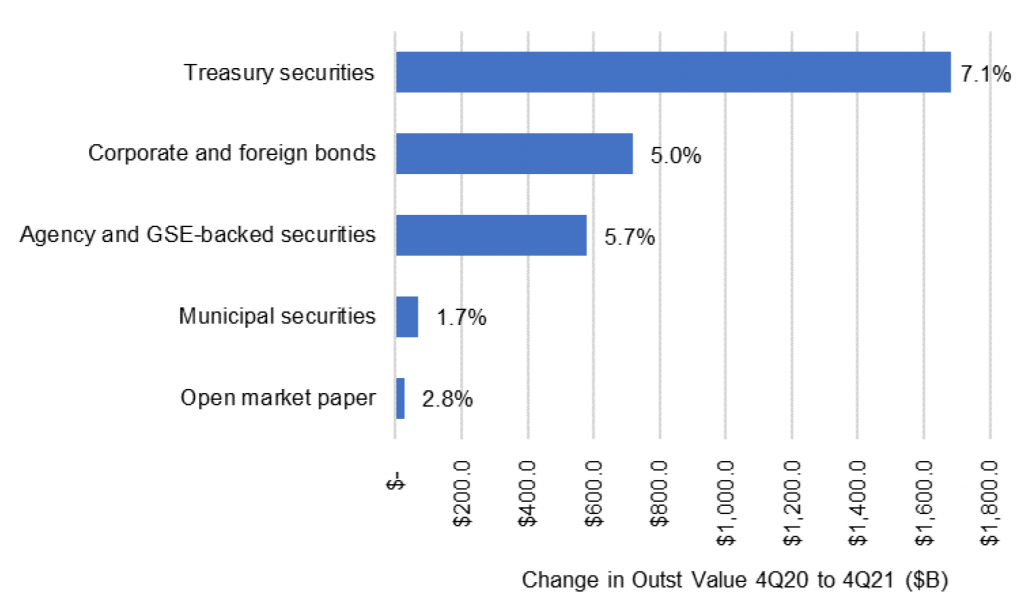
Total debt securities grew last year by nearly $3.1 trillion, according to the Fed’s latest Financial Accounts of the United States, the 5.8% increase falling right in line with real GDP growth of 5.7%. But not every debt sector grew equally. The Treasury market led in both absolute and percentage gains, up nearly $1.7 trillion or 7.1% (Exhibit 1). Corporate and structured debt and foreign bonds outstanding rose $719 billion or 5.0%. And agency debt and MBS rose $579 billion or 5.7%. Municipal securities and open market paper grew by much smaller amounts and at much lower rates. Relative rates of growth in debt reflect differences in activity across the funded sectors.
Exhibit 1: Debt securities outstanding grew $3.1 trillion or 5.8% last year
Source: Federal Reserve Z.1, Amherst Pierpont Securities
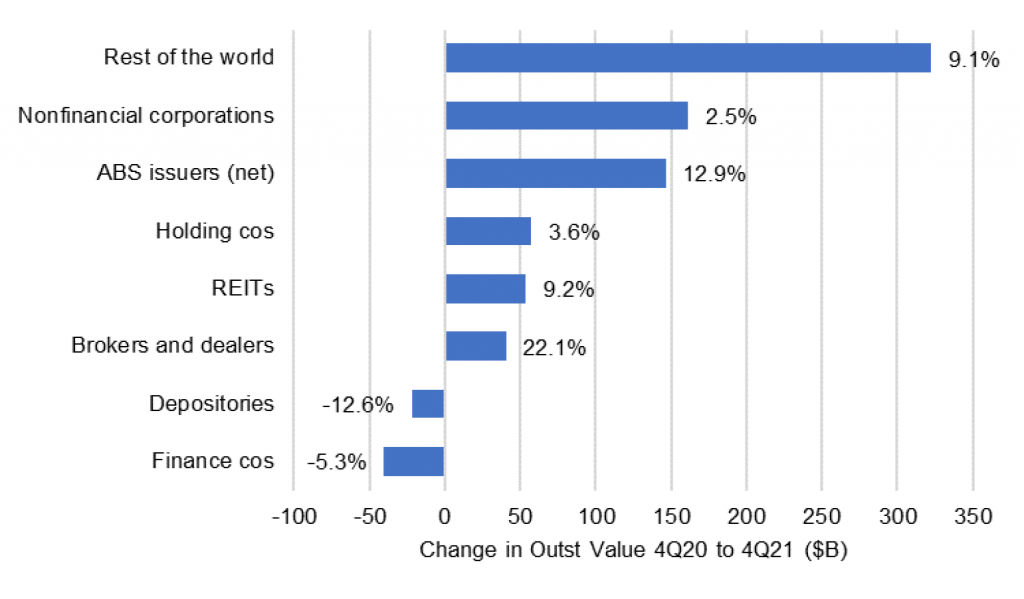
The corporate and foreign bonds sector includes a broader set of issuers than the others. Most of the new outstanding debt in this sector came from US residents holding foreign debt, up $323 billion or 9.1% (Exhibit 2). Traditional corporate debt rose $161 billion or 2.5%, and debt from structured finance trusts—private MBS, CMBS, ABS and other securitizations—rose $147 billion or 12.9%. Bank holding companies, REITs and brokers issued small amounts while debt outstanding from banks and finance companies declined.
Exhibit 2: Corporate and foreign debt gains came from foreign, corporate, ABS
Source: Federal Reserve Z.1, Amherst Pierpont Securities
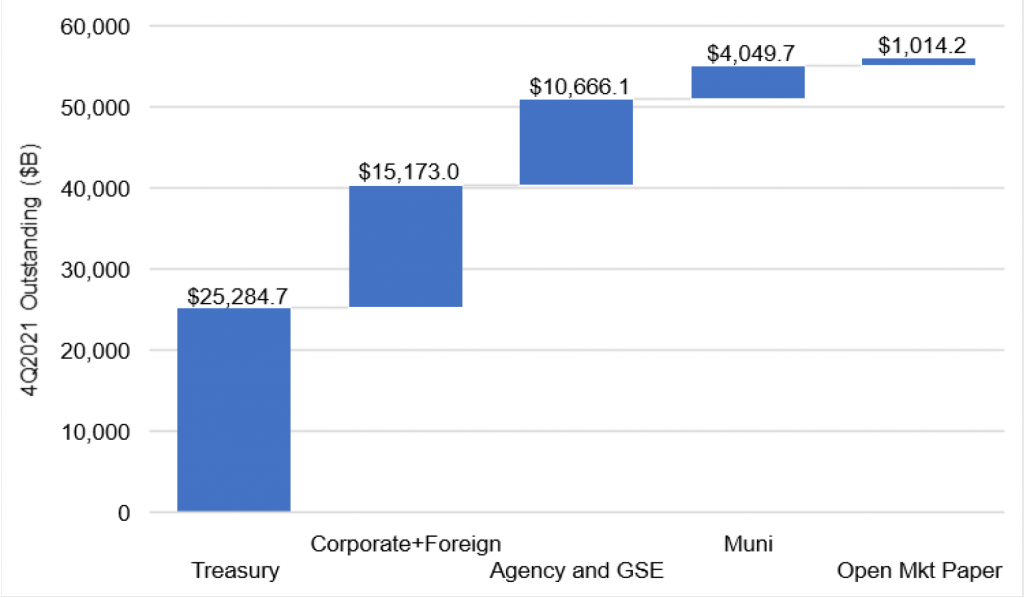
Steady federal deficits have left the $56.2 trillion US dollar debt market dominated by Treasury securities. Riskless rate exposure now makes up 45% of outstanding US dollar debt with corporate and foreign credit adding 27%, agency bullet, callable and MBS prepayment risk adding 19% and muni and open market paper totaling 9% (Exhibit 3).
Exhibit 3: The $56.2 trillion US debt market is dominated by Treasury issues
Source: Federal Reserve Z.1, Amherst Pierpont Securities
Supply should shift a bit this year but stay concentrated in the largest sectors. The Congressional Budget Office projects a falling US fiscal deficit through 2022, so growth in outstanding Treasury debt should fall to roughly $1.1 trillion or a 4.4% gain. Amherst Pierpont projects a strong housing market will push outstanding agency debt and MBS up by $720 billion or 9.2% Corporate and structured debt should rise in line with GDP, up $531 billion or 3.5%.
Debt demand
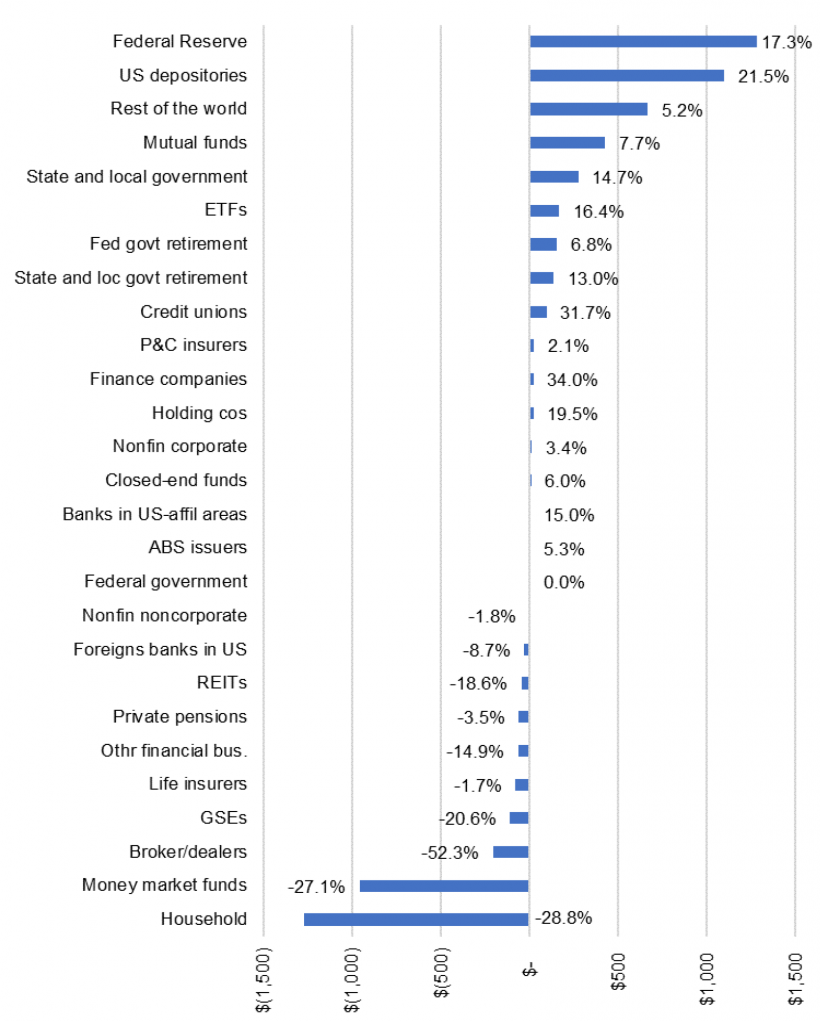
Demand for debt far outstripped supply last year, but that imbalance looks set to turn with the end of QE. Portfolios adding securities bought $4.4 trillion in a market with only $3.1 trillion in organic new supply, requiring other investors to sell a net $1.3 trillion to the buyers (Exhibit 4). The Fed and US banks and other depositories led demand as QE continued and as it put more deposits on bank balance sheets in need of reinvestment. Holdings in both sectors grew between three and four times faster than the 5.8% growth rate of debt overall. Non-US portfolios and mutual funds also added large absolute amounts of debt but more in line with overall debt growth. These types of portfolios are all among the five largest in the market. The only other member of the five largest, life insurers, saw outstanding holdings fall in 2021.
Exhibit 4: The Fed and banks led marginal buyers of debt securities
Source: Federal Reserve Z.1, Amherst Pierpont Securities
The end of QE marks a sharp turn. Net Fed demand should drop to zero and likely go negative as the Fed allows its Treasury and MBS balances to begin rolling off this year. My colleague, Stephen Stanley, anticipates runoff will start in May and that Treasury balances could fall $370 billion this year and MBS balances could fall more than $217 billion. Runoff should pull cash out of the economy and off bank balance sheets, lowering marginal new bank demand. The Fed and banks last year made up $2.4 trillion or 54% of net demand for debt securities. The policy pivot in these portfolios should have sizable effects in the markets where these portfolios invest.
Fixed income mutual funds and ETFs are seeing net outflows so far this year, which may depend on broad public perception of the direction of rates. Demand from life and P&C insurers should turn around, however, as the economy grows. REITs, although holding less than $237 billion in debt securities, should show better demand at current wider spreads.
Market exposure to crosscurrents of supply and demand
The shift in Fed and bank demand will almost certainly not affect all markets equally, and the impact should depend on the recent share of net demand coming from these portfolios.
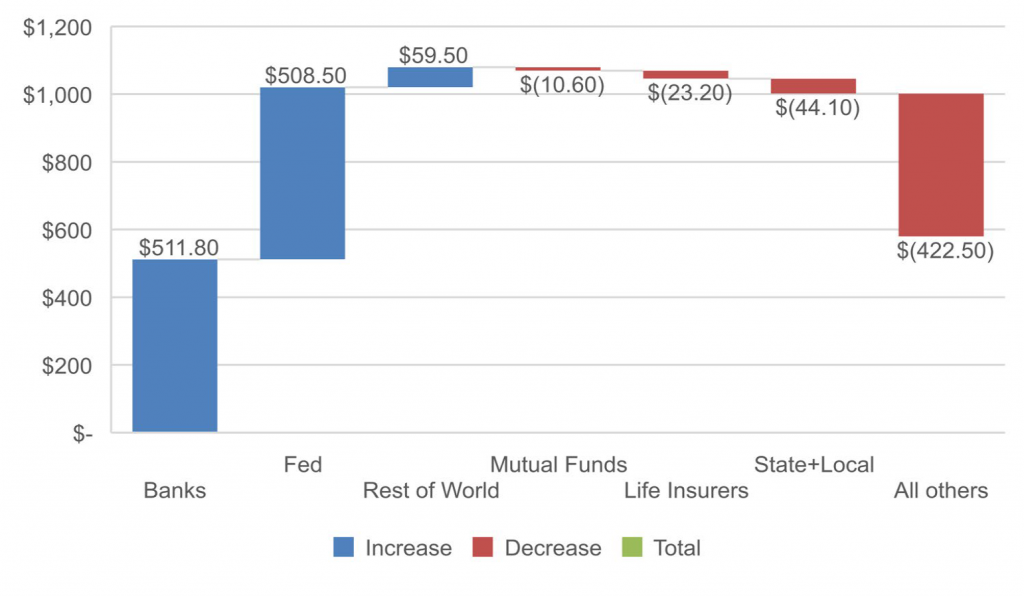
The most vulnerable market is the one in agency debt and MBS, where the Fed and banks in 2021 made up more than $1 trillion or 94% of net demand (Exhibit 5). These portfolios alone added more than the net new supply of debt, requiring other portfolios to sell. Other large portfolios—non-US investors, mutual funds and life insurers—broadly held their positions constant. Other smaller portfolios sold to the Fed and banks. The Fed’s shift from net buyer to passive seller and banks’ lower appetite ahead of strong growth in MBS should make this year one of the most challenging for clearing supply and demand in the history of the market.
Exhibit 5: Agency debt and MBS look most vulnerable to a Fed, bank pivot
Source: Federal Reserve Z.1, Amherst Pierpont Securities
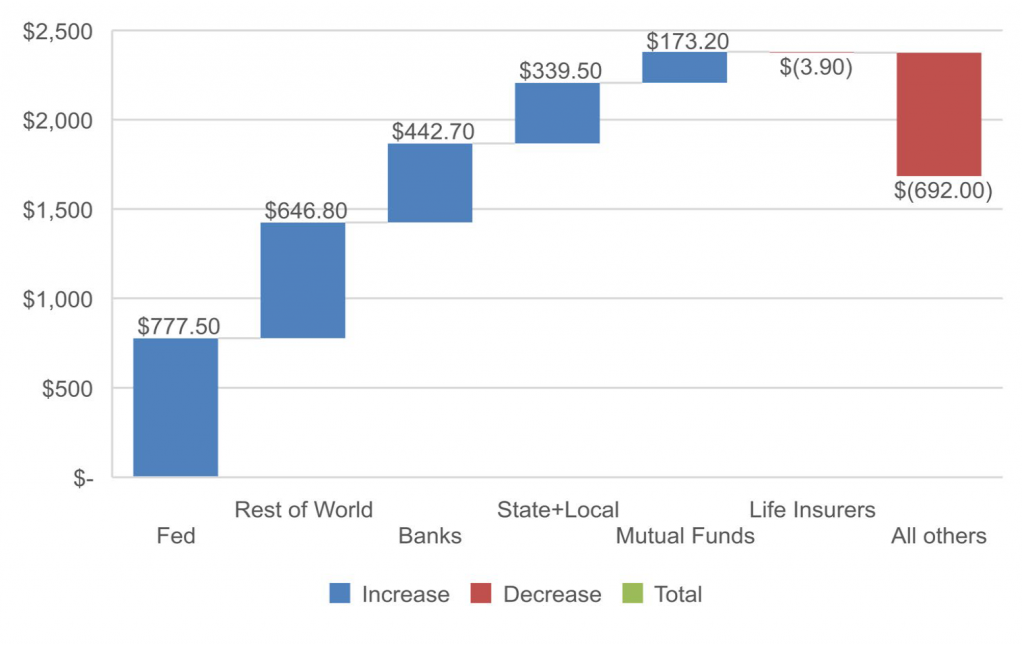
The Treasury market is less vulnerable to a Fed and bank pivot. These portfolios made up $1.2 trillion or 51% of net demand. Non-US portfolios, state and local portfolios and mutual funds also added to positions (Exhibit 6). The global market for US Treasury debt, rising appetite for safety and liquidity and declining growth in net new Treasury debt should allow this market to transition away from the Fed and bank bid more smoothly.
Exhibit 6: The Treasury market is vulnerable but more diversified
Source: Federal Reserve Z.1, Amherst Pierpont Securities
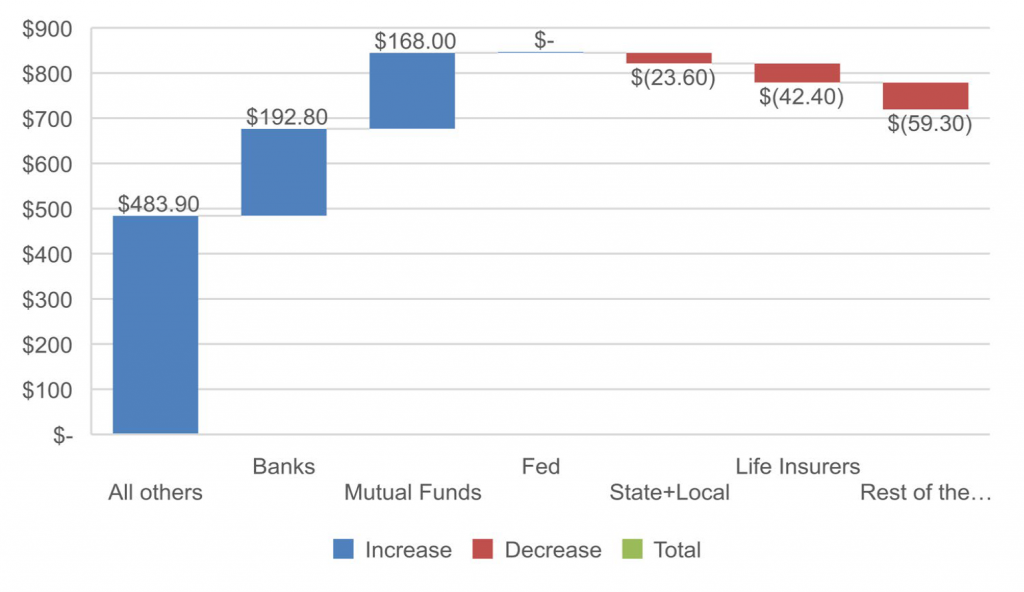
The market least vulnerable to a shift in Fed and bank demand is corporate and foreign debt, where the Fed and banks last year provided $193 billion or 23% of net demand (Exhibit 7). Mutual funds added to their positions, and the bulk of demand came from smaller portfolios. The market in corporate and foreign debt looks the most diversified of the major categories of debt and least likely to be directly affected shifts in the Fed or bank portfolios.
Exhibit 7: Corporate and foreign debt is most diversified and least vulnerable
Source: Federal Reserve Z.1, Amherst Pierpont Securities
The market has started to price the Fed and bank pivot
The market has priced to a steadily more aggressive Fed since late November with both credit and MBS widening, but lately the two markets have parted ways. Since the March FOMC, credit has tightened while MBS has continued to leak wider (Exhibit 8). Tightening arguably reflects confidence in the Fed’s expectation of continued growth and in its ability to tame inflation. But wider spreads in MBS likely reflect the impact of the Fed’s quick pivot from buyer to passive seller. Some of the pivot is already priced in, but MBS remains vulnerable until the next marginal buyer steps forward. So far, that next buyer is far from clear.
Exhibit 8: Since the March FOMC, credit and MBS spreads have diverged
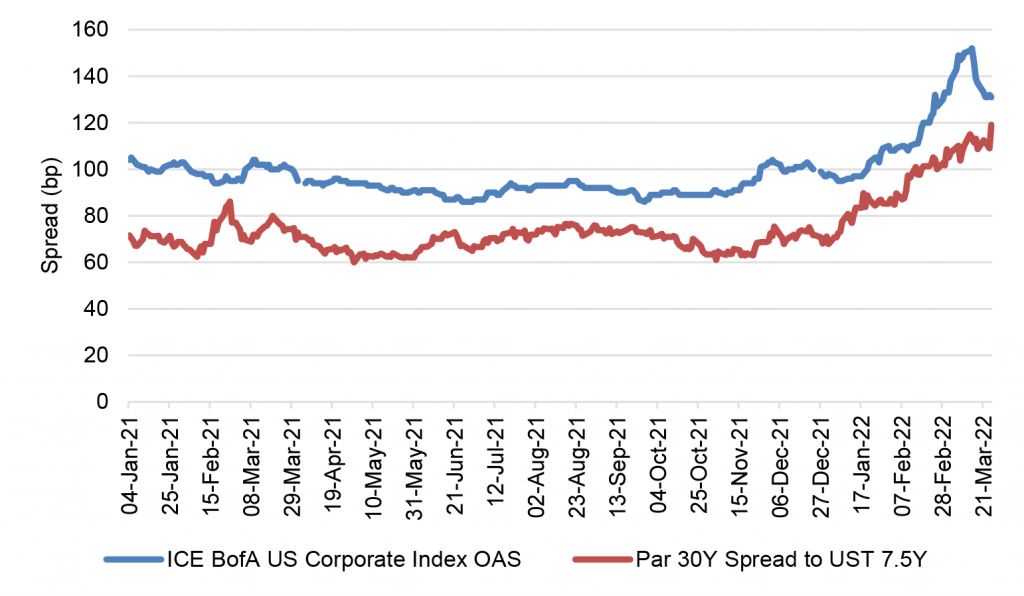
Source: ICE Data Indices, LLC, as retrieved from FRED, Bloomberg, Amherst Pierpont Securities
* * *
The view in rates
The Fed’s RRP balances closed Friday at $1.67 trillion, slightly above average for the year. The RRP rate after the March 16 FOMC rose from 5 bp to 30 bp, and the race is on to see if banks raise rates to defend their deposit base or let deposits flow into money market funds and on to the RRP. If that plays out, it could weaken bank demand for Treasury debt and MBS.
Settings on 3-month LIBOR have closed Friday at 97 bp, up 5 bp in the last week. Setting on 3-month SOFR have drifted up to 63 bp, up 11 bp in the last week. The spread between 3-month LIBOR and SOFR has tightened in the last week after widening since Russia’s February 24 invasion of Ukraine.
The 10-year note has finished the most recent session at 2.48%, up 28 bp in a week. Breakeven 10-year inflation finished the week at 298 bp, up 8 bp on the week. Rising breakeven inflation may be prompting some of the hawkish comments from the Fed about 50 bp hikes. The 10-year real rate finished the week at negative 50 bp, up 25 bp from a week ago. Real rates continue to rebound sharply from the local low point after the Russia invasion.
The Treasury yield curve has finished its most recent session with 2s10s at 20 bp, flatter by only 1 bp in the last week, and 5s30s at 4 bp, flatter by 24 bp over the last week.
The view in spreads
Spreads still look broadly biased to widen. The recent FOMC took a material piece of risk out of the market by clarifying the Fed path, but the Fed has since needed to further clarify that 50 bp hikes are still on the table. And Russia-Ukraine remains. Of the major spread markets, corporate and structured credit is likely to outperform, as it has generally since March 2020. Corporates benefit from strong corporate fundamentals and from buyers not tied to Fed policy. The credit markets have a diversified base of buyers while the only net buyers of MBS during pandemic have been the Fed and banks.
The view in credit
Credit fundamentals look strong for now but will almost certainly soften later this year as the Fed dampens demand and growth begins to slow. Russia-Ukraine should have limited direct impact on either the US corporate or consumer balance sheet. Corporations have strong earnings, good margins, low multiples of debt to gross profits, low debt service and good liquidity. It will be important to watch inflation and see if costs begin to catch up with revenues. A higher real cost of funds would start to eat away at highly leveraged balance sheets with weak or volatile revenues. Consumer balance sheets look strong with rising income, substantial savings and big gains in real estate and investment portfolios. Homeowner equity jumped by $3.5 trillion in 2021, and mortgage delinquencies have dropped to a record low.