


The Big Idea
The impact of slower growth, rising rates on credit
Steven Abrahams | April 1, 2022
This document is intended for institutional investors and is not subject to all of the independence and disclosure standards applicable to debt research reports prepared for retail investors.
The market has now priced in a quick Fed effort to cool the economy with the forward curve anticipating 2-year and shorter Treasury rates at or above 3% a year from now. And even that may not be enough. But that brings into focus the impact on corporate balance sheets and credit from slower growth and a higher cost of funds. Most investment grade and high yield debt looks well insulated. But the $1.35 trillion leveraged loan market looks vulnerable. Time to migrate up in quality.
A steep inversion of the yield curve
The Treasury curve now implies one of the steepest inversions over the next year since 1982. Implied 2-year and shorter rates a year from now stand within basis points of 3.00% while the 10-year rate sits within basis points of 2.50% (Exhibit 1). The quick repricing of the curve over the last two weeks reflects the growing perception that lingering effects of Fed policy, fiscal policy, pandemic rebound and supply and trade frictions—freshly exacerbated by Russia-Ukraine—will require much tighter Fed policy to beat inflation. The risk is that shorter rates still are 25 bp to 50 bp too low. But lower rates in the longer end of the curve suggest the Fed will win. The Philly Fed Survey of Professional Forecasters, released at the end of March, suggests growth will slow from current levels back toward 2%. Of course, tight Fed policy could push it temporarily lower.
Exhibit 1: Forward rates imply one of the steepest 2s10s inversions since 1982
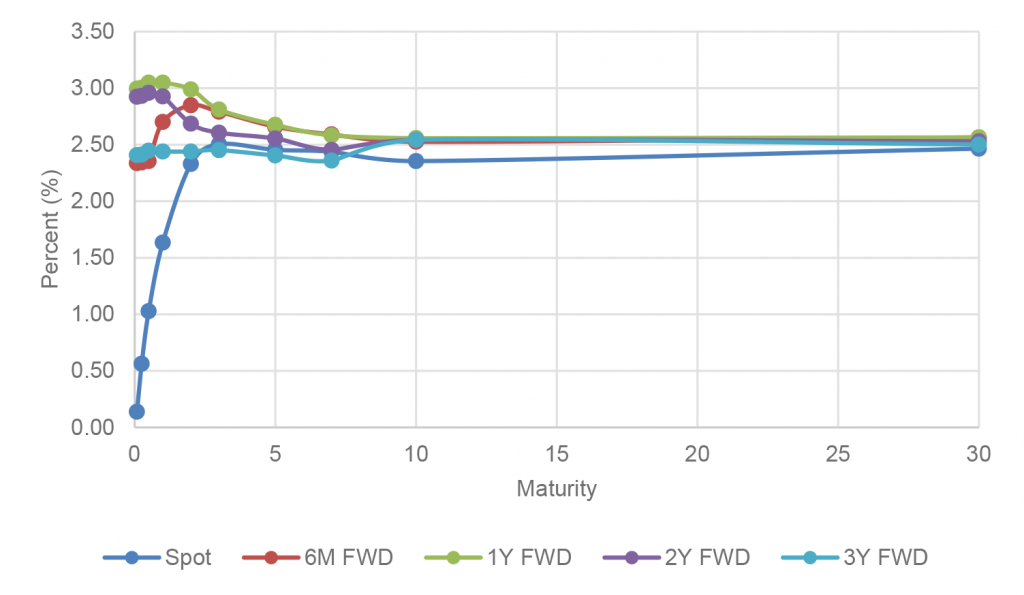
Source: Bloomberg, Amherst Pierpont Securities
Starting from a strong place
Corporate balance sheets in general are heading into slower growth and a higher cost of funds with plenty of cushion. Among other things, absolute corporate profits have rarely been stronger, rising roughly $500 billion or 25% from levels of only a few years ago and offering some protection against falling revenues (Exhibit 2).
Exhibit 2: Corporate profits have jumped by $500 billion in recent years
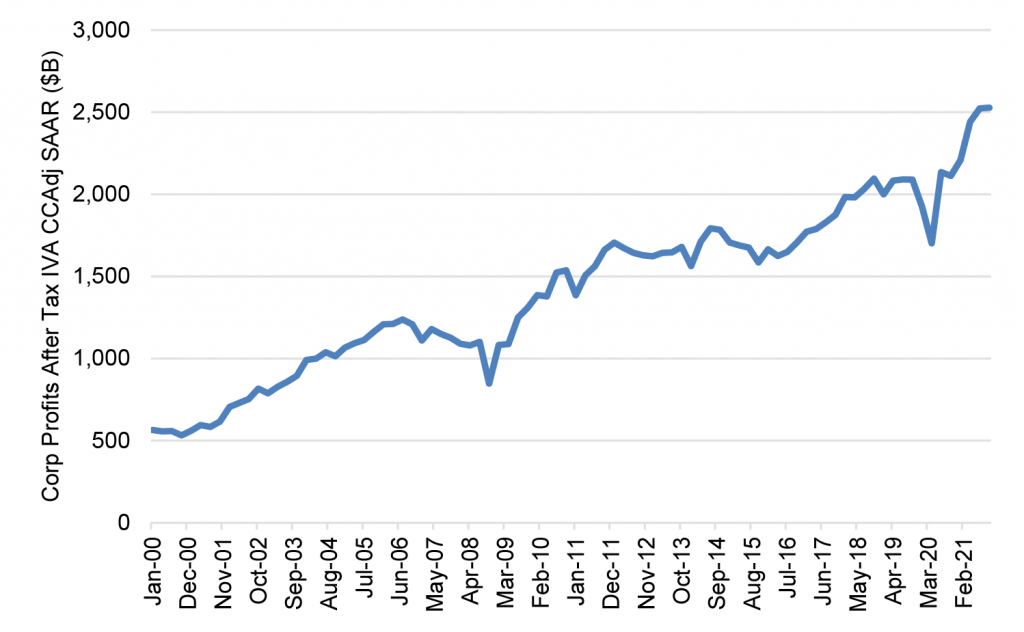
Source: Federal Reserve Economic Data, Amherst Pierpont Securities
High profits can mask vulnerability to rising costs, of course—either from inflation or higher rates—but profit corporate margins also have improved. Margins after adjusting for input costs have moved from around 12% before pandemic to around 15% at the most recent reading (Exhibit 3). Healthy margin should cushion pending higher costs. Companies also show good liquidity from stockpiling cash through pandemic, adding to their ability to weather a downturn.
Exhibit 3: High corporate profit margins should cushion rising costs
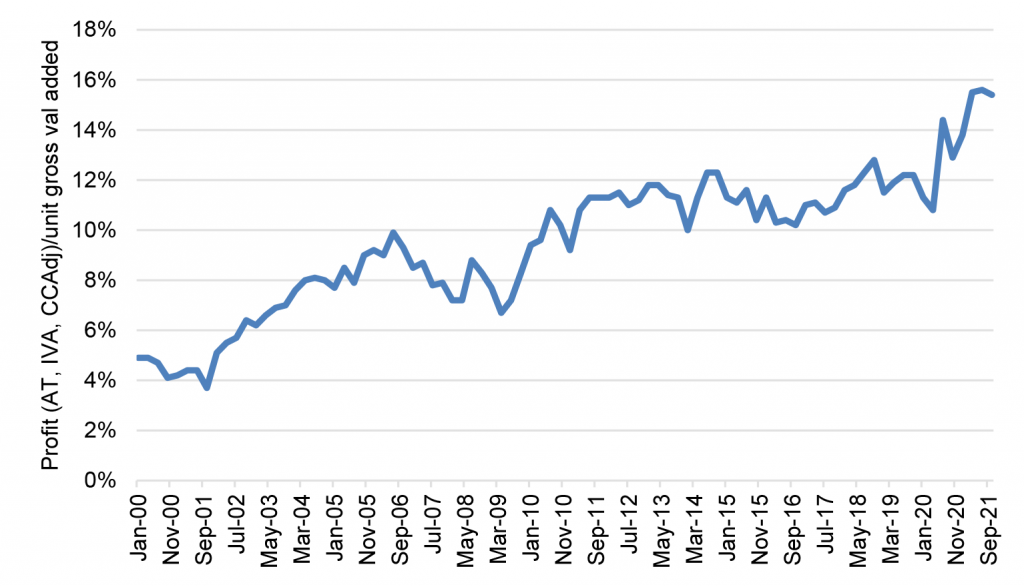
Source: Federal Reserve Economic Data, Amherst Pierpont Securities
Interest rate exposure varies significantly across credit sector
Despite a broadly positive picture, not all corporate balance sheets are equal when it comes to interest rate exposure. Investment grade companies have generally taken advantage of markets in 2020 and 2021 to issue debt with longer maturities and lock in lower rates. The duration of the Bloomberg/Barclays $6.5 trillion investment grade corporate index, for example, has gone from 7.0 years at the start of 2019 to nearly 8.5 years lately, insulating these issuers further from the impact of rising rates (Exhibit 4). The duration of the Bloomberg/Barclays $1.5 trillion high yield debt index, on the other hand, has roughly stayed the same at around 4.0 years, suggesting more leveraged issuers either showed less initiative to extend maturity or, more realistically, could not issue at longer maturities in the high yield market. High yield issuers have the same exposure to rising rates that they did in 2019, but the risk of rising rates—at least over the next few years—is higher.
Exhibit 4: Investment grade issuers have used pandemic to extend maturities
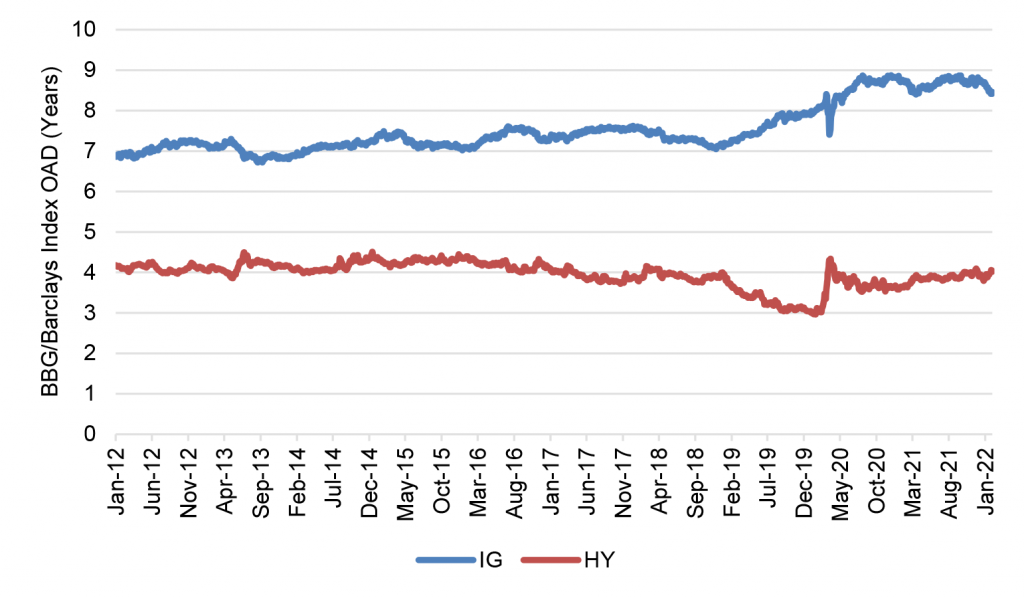
Source: Bloomberg, Amherst Pierpont Securities
The sector of credit most vulnerable to rising rates, however, is the $1.35 trillion market in leveraged loans. Almost all loans float off 1- or 3-month LIBOR or, increasingly, SOFR. Forward rates anticipate 3-month LIBOR will rise over the next year from late 2021 levels of 0.22% to more than 3.00%. That would push the average coupon in the leveraged loan market from its late 2021 mark of 4.14% to 6.85% (Exhibit 5). In other words, all else equal, the average issuer would see interest rate expense rise 65% or more.
Exhibit 5: Forward rates imply the average loan index could rise from 0.22% to 2.93% and the coupon from 4.14% to 6.83%–a 65% increase in interest expense
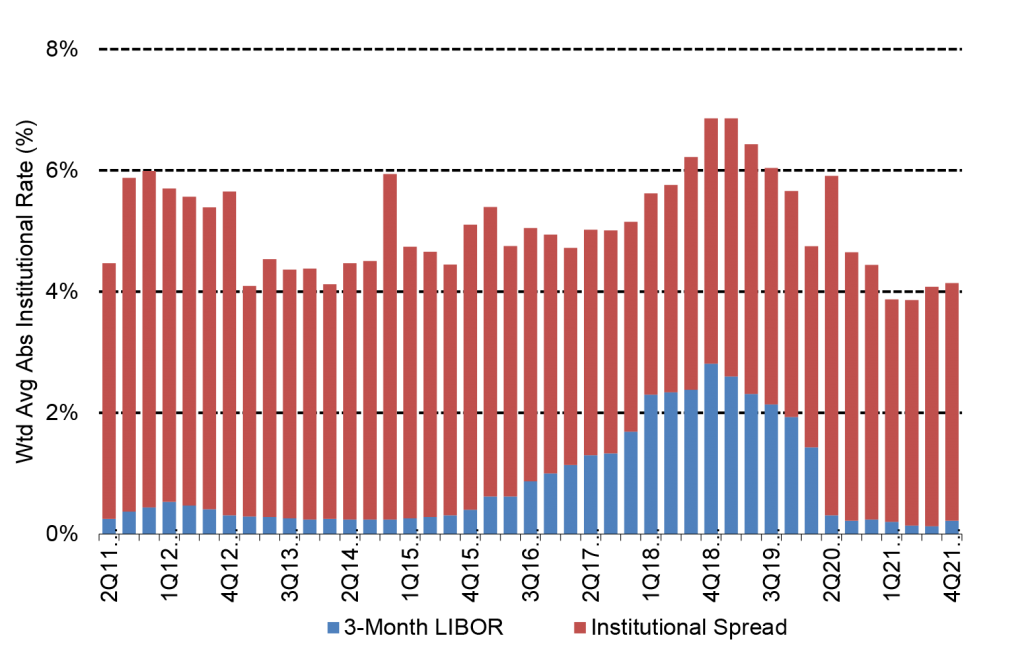
Source: LCD, Amherst Pierpont Securities
A sharp rise in interest expense for leveraged borrowers could push their cushion for covering debt to some of the lowest levels of the last few decades. The current average leveraged borrower has an earnings-to-interest-expense ratio of 4.1 (Exhibit 6). If every $1 of interest expense became $1.65 a year from now, the ratio would drop just below 2.5. That would put average debt service coverage ratio below the level last seen when the Fed stopped hiking at the end of 2018, and below the level last seen when the Fed stopped hiking in 2006. Many leveraged borrowers at that point would have very little room for error, especially in a slowing economy.
Exhibit 6: A rise in interest expenses could pull DSCR from 4.1 down to 2.5
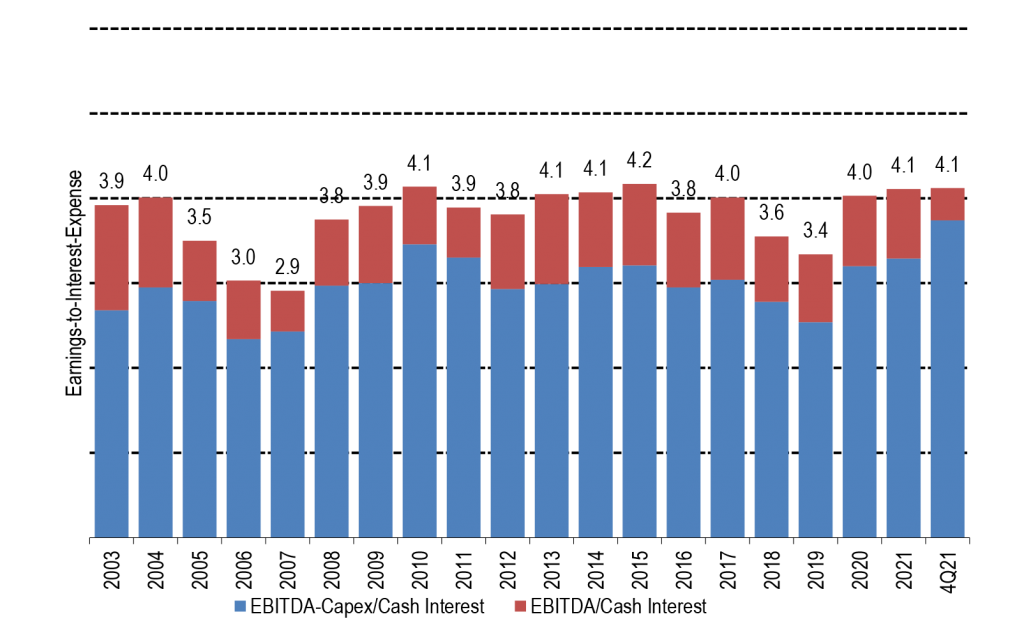
Source: LCD, Amherst Pierpont Securities
Go up in quality
The surprising tightening in credit spreads since the March 16 FOMC suggests the market is valuing current growth more than a potential future slowdown, but that slowdown seems inevitable. Market may have already priced in some reduction in earnings growth, but it seems the Fed will have to do more to slow inflation rather than less and that growth will slow more than expected rather than less. Spreads on investment grade companies may soften as growth slows, but fortified balance sheets and extended debt maturities give them plenty of protection. High yield issuers have less protection, although they have at least some buffers from rising rates. Leveraged borrowers are vulnerable. Investors in loans should move from lower to higher ratings or into high yield. Investors in CLOs should move from managers with high risk and high beta to managers with low beta. And along with shifting to low beta mangers, investors in CLOs should move higher in the capital stack.
* * *
The view in rates
After some significant repricing in the last three weeks, the market seems much closer to a realistic view of the next year. The curve should invert significantly over the next year with 2-year rates around 3.0% or higher and 10-year rates around 2.5%. Persistent supply and trade frictions from Russia-Ukraine could force the Fed to go higher than currently priced and push the 2-year note toward 3.5%.
The Fed’s RRP balances closed Friday at $1.67 trillion, almost unchanged over the last week. The RRP rate after the March 16 FOMC rose from 5 bp to 30 bp, and the race is on to see if banks raise rates to defend their deposit base or let deposits flow into money market funds and on to the RRP. So far, that seem not the case.
Settings on 3-month LIBOR have closed Friday at 96 bp, up 1 bp in the last week. Setting on 3-month SOFR have drifted up to 68 bp, up 7 bp in the last week. The spread between 3-month LIBOR and SOFR has tightened in the last few weeks after initially widening after Russia’s February 24 invasion of Ukraine.
The 10-year note has finished the most recent session at 2.38%, down 10 bp in a week. Breakeven 10-year inflation finished the week at 282 bp, down 16 bp on the week. The 10-year real rate finished the week at negative 43 bp, up 7 bp from a week ago. Real rates continue to rebound sharply from the local low point after the Russia invasion.
The Treasury yield curve has finished its most recent session with 2s10s inverted by 7 bp, flatter by 27 bp in the last week, and 5s30s inverted by 13 bp, flatter by 37 bp over the last week.
The view in spreads
Spreads still look broadly biased to widen. Repricing since the March FOMC has taken sizable risk out of the market, but Russia-Ukraine remains. Of the major spread markets, corporate and structured credit is likely to outperform, as it has generally since March 2020. Corporates benefit from strong corporate fundamentals and from buyers not tied to Fed policy. The credit markets have a diversified base of buyers while the only net buyers of MBS during pandemic have been the Fed and banks.
The view in credit
Credit fundamentals look strong for now but will almost certainly soften later this year as the Fed dampens demand and growth begins to slow. Russia-Ukraine should have limited direct impact on either the US corporate or consumer balance sheet. Corporations have strong earnings, good margins, low multiples of debt to gross profits, low debt service and good liquidity. It will be important to watch inflation and see if costs begin to catch up with revenues. A higher real cost of funds would start to eat away at highly leveraged balance sheets with weak or volatile revenues. Consumer balance sheets look strong with rising income, substantial savings and big gains in real estate and investment portfolios. Homeowner equity jumped by $3.5 trillion in 2021, and mortgage delinquencies have dropped to a record low.