


The Big Idea
Historic unrealized losses on securities for banks
Steven Abrahams | April 22, 2022
This document is intended for institutional investors and is not subject to all of the independence and disclosure standards applicable to debt research reports prepared for retail investors.
Rising interest rates and widening spreads on MBS and other securities have handed US banks some of their largest investment losses in at least 25 years. Bank investment portfolios have dropped nearly $66 billion in market value this year, nearly as much as the portfolios lost at the height of the 2008 financial crisis. The investment losses have almost certainly put pressure on bank capital and sent many scrambling to reduce their risk-weighted assets. Demand for Ginnie Mae MBS and other securities with favorable bank risk weightings looks set to rise sharply.
Nearly $66 billion in unrealized losses on AFS portfolios
Large US commercial banks through March 30 reported unrealized losses on available-for-sale investment portfolios of nearly $63 billion (Exhibit 1). That represents a drop of nearly $66 billion since the end of December and nearly $96 billion since portfolio value peaked last August. Bank portfolio value from peak to trough in 2008, by comparison, declined by only $74 billion.
Exhibit 1: Bank AFS portfolios have lost $63 billion in value this year
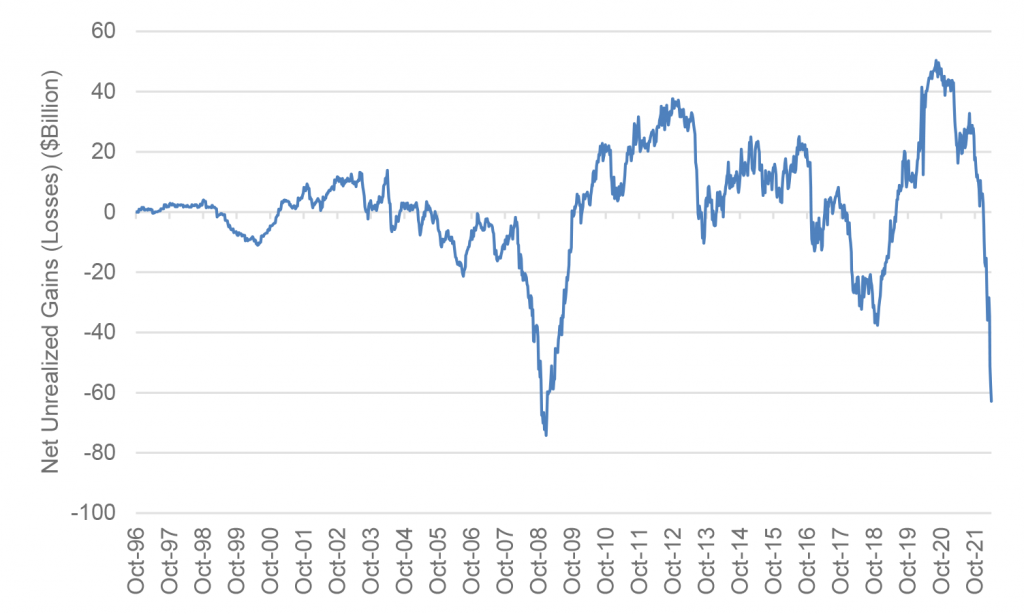
Source: Federal Reserve, H.8, Amherst Pierpont Securities
Unlike 2008 when wider spreads in a variety of portfolio holdings drove bank losses and when interest rates declined at the end of the year, losses so far this year have largely come from wider spreads and rising rates. Rules requiring banks to hold liquid assets have encouraged large holdings in Treasury debt and agency MBS. The 5-year Treasury rate from January through March jumped 120 bp and the nominal spread of par 30-year MBS to the 7.5-year Treasury widened 41 bp. Although every bank holds a unique portfolio, the Bloomberg/Barclays index of Treasury debt lost 5.6% through March and the index of agency MBS lost 5.0%, among the largest quarterly losses of the last 30 years.
The impact on bank capital
The value of securities in the available-for-sale portfolio matter for bank capital, but the impact varies depending on the size of the bank. Securities initially get recorded at their purchase or book value and then marked-to-market quarterly. For all banks, the change in value goes into an accounting category known as accumulated other comprehensive income, or AOCI, and gets reflected in shareholder equity. The change does not get reflected in quarterly income unless the position is sold. For banks subject to regulators’ advanced approach to capital—generally banks with at least $250 billion in total assets or at least $10 billion in foreign exposure—the change also gets counted for regulatory capital tests. Other banks have the option to filter changes in AOCI out of their regulatory capital, and most do. Filtering out AOCI allows a bank to take interest rate risk in the available-for-sale portfolio without showing its impact in regulatory capital. But any bank interested in potential M&A still needs to worry about its actual, tangible capital. And the impact of AOCI still shows up there.
Bank regulators will compare Tier I capital—shareholder equity and retained earnings—to total risk-weighted assets, and banks have to maintain prudent capital ratios. US commercial banks at the end of 2021 held $1.884 trillion in Tier 1 capital, according to the FDIC, so the loss of $66 billion in the available-for-sale portfolio represents 3.45% of that base.
The impact of capital on asset composition
The impact of a $66 billion loss on capital ratios will depend on the kind of assets a bank holds. If an asset is 100% risk-weighted, such as a typical commercial or industrial loan, the bank needs to hold $0.08 for every $1 of par value. A loss of $66 billion in that case would erase the capital supporting $812.5 billion in assets. If an asset is 20% risk-weighted, such as a Fannie Mae or Freddie Mac MBS or a Federal Home Loan Bank debenture, the bank needs to hold $0.016 for every $1 of par value, In that case, a $66 billion loss erases capital supporting $4.0625 trillion in assets. But if an asset is 0% risk-weighted, such as a US Treasury or Ginnie Mae MBS, the bank needs to hold $0.00 in capital—subject to a leverage ratio limit. So a bank may be able to weather substantial unrealized losses by holding 0% risk-weighted assets. Of course, banks that have to show AOCI in shareholder equity are most likely to respond to available-for-sale losses, and those banks are only a subset of the total commercial bank loss.
Signs already of a bank bid for Ginnie Mae MBS
Although Fed balance sheet normalization is almost certain to reduce or even reverse bank deposit growth and dampen bank demand for assets, the substantial losses in available-for-sale portfolio so far this year will likely drive banks to substitute assets with low risk-weightings for assets with high risk-weightings. Treasury debt and Ginnie Mae MBS look like the prime candidates for reinvestment out of other assets, with MBS holding the usual appeal of wider spread to funding. Anecdotally, bank demand for Ginnie Mae MBS already has started to pick up.
Of course, the other side of better demand for Treasury debt and Ginnie Mae MBS is weaker demand for other assets that banks might buy. The most obvious candidate is conventional MBS.
A reasonable entry point for Ginnie Mae
Portfolios investing for total return have a reasonable case for preferring Ginnie Mae over conventional MBS. Optional-adjusted spreads in Ginnie Mae MBS are slightly wider—65 bp of OAS in the par 30-year Ginnie Mae, 60 bp of OAS in the par 30-year conventional (Exhibit 2). The dollar roll financing across the two markets is comparable. And a steady, well-funded bank bid is likely to drive Ginnie Mae valuations higher.
Exhibit 2: A reasonable entry point for adding Ginnie Mae
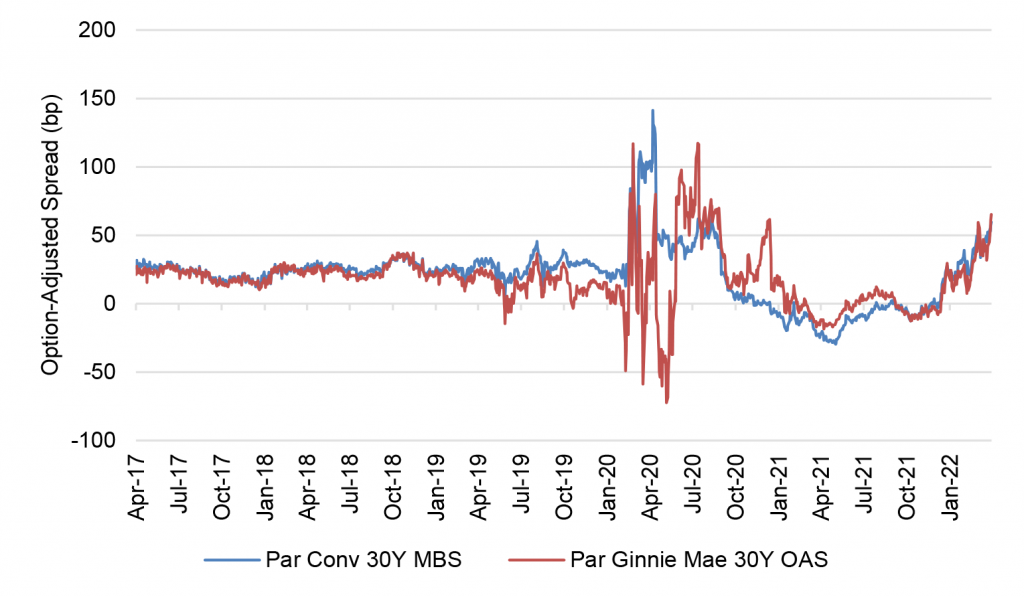
Source: Bloomberg, Amherst Pierpont Securities
One unique risk in Ginnie Mae MBS is the looming discussion of FHA mortgage insurance premiums. Another year of healthy home price appreciation is likely to drive aggregate loan-to-value in FHA-insured loans down again, leaving the FHA insurance fund with an even larger surplus. The drumbeat of demand to lower insurance premiums is likely to start again. Although FHA still seems likely to roll out targeted subsidies rather than a large, across-the-board cut, some change in premiums seems likely. The big difference this year is that almost the entire Ginnie Mae market now trades below rather than above par. A cut in premiums would add negative convexity in the long run but add yield to a discount market in the short run.
Held-to-maturity
The available-for-sale portfolio is only part of the picture of bank exposure to securities, the other part is sitting in the held-to-maturity portfolio. Because securities in held-to-maturity do not get marked-to-market and do not affect AOCI or shareholder capital, banks have had significant incentive in recent years to move securities into held-to-maturity. And the incentive is especially strong for securities with the longest duration and most interest rate sensitivity. Although those securities do not show up in reported capital, they are part of the true economic duration of a bank balance sheet. Good bank management knows the impact of changes in the value of held-to-maturity. What management does about it remains to be seen.
* * *
The view in rates
The rates market continues to reprice to higher yields, but the bulk of repricing for the foreseeable future is likely over. Shorter maturities may reprice slightly higher. The longer end of the curve looks wide to fair value and could reprice a little lower. The curve should invert significantly over the next year with 2-year rates around 3.0% or higher and 10-year rates around 2.5%. Persistent supply and trade frictions from Russia-Ukraine could force the Fed to go higher than currently priced and push the 2-year note toward 3.5%. Friday closing rates on 10-year and longer Treasury debt at 2.90% and higher look like the wide end of fair value—more than enough to compensate for likely 2% inflation and 0.5% in real rates.
The Fed’s RRP balances closed Friday at $1.765 trillion, up $59 billion in the last week. The RRP rate after the March 16 FOMC rose from 5 bp to 30 bp, and the race is on to see if banks raise rates to defend their deposit base or let deposits flow into money market funds and on to the RRP. So far, that seem not the case.
Settings on 3-month LIBOR have closed Friday at 119 bp, up 19 bp in the last week. Setting on 3-month SOFR have drifted up to 98 bp, up 20 bp in the last week. This is the first week since the start of the Russia-Ukraine war that both indices have moved in parallel.
The 10-year note has finished the most recent session at 2.90%, up 20 bp in a week. Breakeven 10-year inflation finished the week at 298 bp, up 9 bp on the week. The 10-year real rate finished the week at negative 8 bp, up 10 bp from a week ago. Real rates increasingly anticipate an aggressive Fed will drain the system of an overhang of cash supply.
The Treasury yield curve has finished its most recent session with 2s10s at 23 bp, steeper by 4 bp in the last week but flattening in the last few sessions, and 5s30s at 1 bp, steeper by 4 bp over the last week but similarly flattening in the last few sessions.
The view in spreads
Spreads still look broadly biased to widen in both MBS and credit. Repricing since the March FOMC has taken sizable risk out of the market although plenty remains around inflation and the Fed path. And Russia-Ukraine remains. Of the major spread markets, corporate and structured credit is likely to outperform, as it has generally since March 2020. Corporates benefit from strong corporate fundamentals and from buyers not tied to Fed policy. The credit markets have a diversified base of buyers while the only net buyers of MBS during pandemic have been the Fed and banks.
The view in credit
Credit fundamentals look strong for now but will almost certainly soften later this year as the Fed dampens demand and growth begins to slow. Russia-Ukraine should have limited direct impact on either the US corporate or consumer balance sheet. Corporations have strong earnings, good margins, low multiples of debt to gross profits, low debt service and good liquidity. It will be important to watch inflation and see if costs begin to catch up with revenues. A higher real cost of funds would start to eat away at highly leveraged balance sheets with weak or volatile revenues. Consumer balance sheets look strong with rising income, substantial savings and big gains in real estate and investment portfolios. Homeowner equity jumped by $3.5 trillion in 2021, and mortgage delinquencies have dropped to a record low.