


The Big Idea
Support from a strong hand at insurers
Steven Abrahams | May 6, 2022
This document is intended for institutional investors and is not subject to all of the independence and disclosure standards applicable to debt research reports prepared for retail investors.
Insurance company investment portfolios generally came into this year in good shape, with the carrying value of cash and invested assets at both life and P&C companies at record highs. Life companies had managed to raise portfolio net yield, and both life and P&C companies had maintained portfolio credit quality. Both had continued to increase allocation to private credit. On balance, higher rates have probably helped this year more than hurt, leaving insurers among the stronger portfolios in the market.
Life companies came into the year with nearly $4.9 trillion in cash and invested assets and P&C companies with $2.2 trillion (Exhibit 1). Both represented the highest levels in a decade. Growth has accelerated during pandemic. Life portfolios have grown since 2012 at a compounded annual rate of 4.1% but since 2019 at 6.1%. And P&C companies have grown since 2012 at a compounded annual rate of 5.3% and since 2019 at 8.9%. Demand for P&C insurance during pandemic and low claims rates in some lines of business—autos, a clear example—have helped recent P&C portfolio growth.
Exhibit 1: Life and P&C investment portfolios started the year at record highs
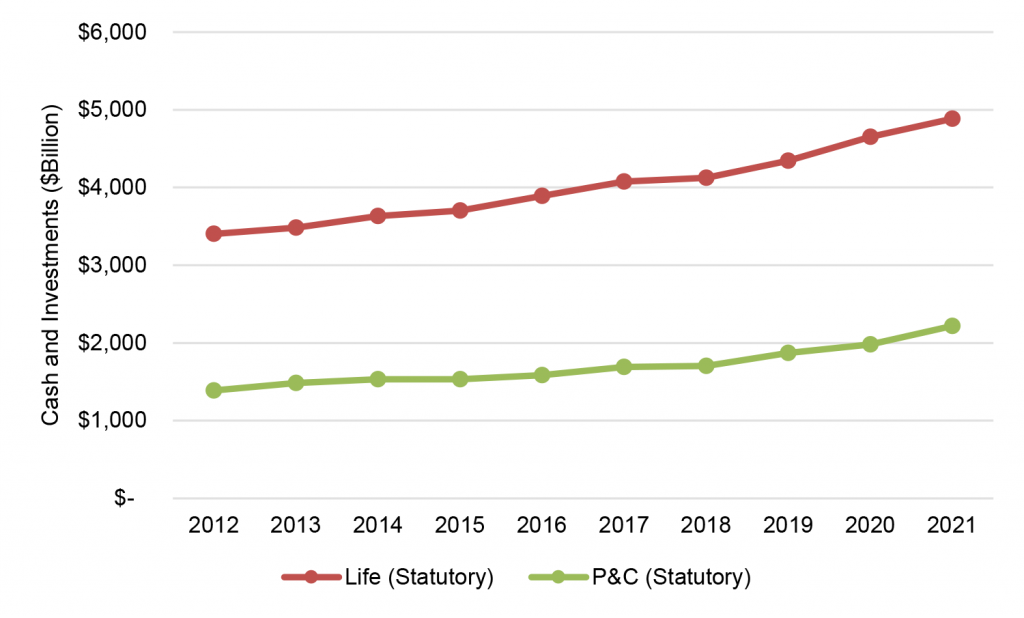
Source: CreditSights, all rights reserved, Amherst Pierpont Securities
Investment portfolio yields managed to tip up for life companies last year and will almost certainly rise this year, and P&C companies may see big yield gains. The 4.21% net yield posted at the start of this year marked only the second year-over-year increase for life portfolios in a decade (Exhibit 2). P&C companies saw net yields fall again last year, but P&C portfolios hold assets with shorter duration and more subject to reinvestment risk. Higher yields this year should lift P&C company yields sharply.
Exhibit 2: Insurer net yield should rise in life and P&C portfolios this year
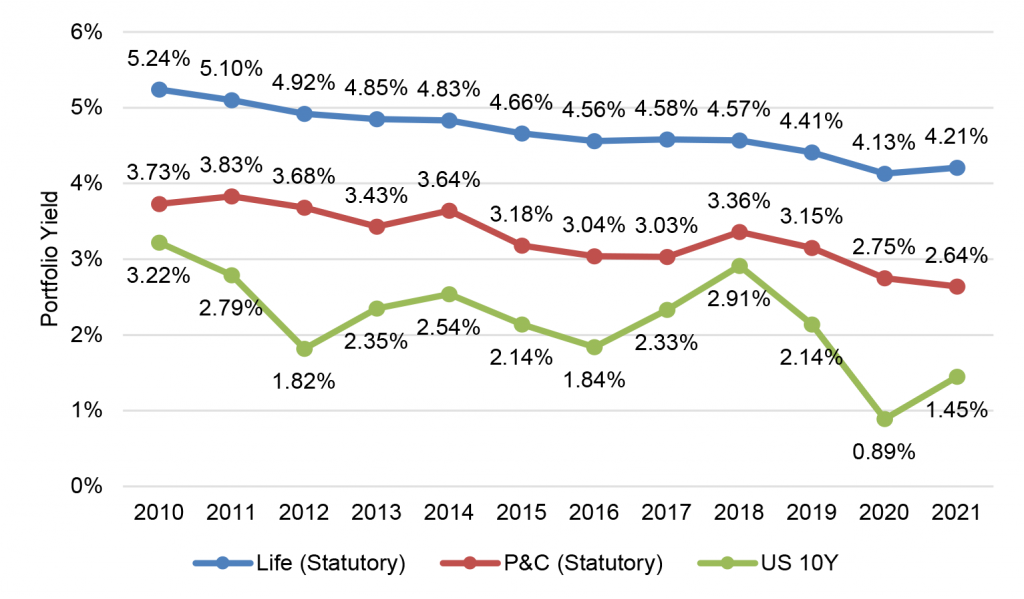
Source: CreditSights, all rights reserved, Amherst Pierpont Securities
Both sectors have remained strong bids for fixed income. Life portfolios entered holding more than 71% fixed income securities followed by more than 13% in mortgage loans—mainly commercial. P&C portfolios started with more than 59% fixed income followed by nearly 24% in common stock.
Both life and P&C fixed income portfolios have skewed steadily toward corporate and structured credit. Corporate credit still dominates the mix although varying significantly from company to company. Life companies held 78% of their fixed income debt in corporate and structured credit, P&C companies held 48% (Exhibit 3). Both types of portfolios also held sizable positions in municipal special revenue bonds and in Treasury debt.
Exhibit 3: Corporate and structured credit continues to dominate insurer holdings
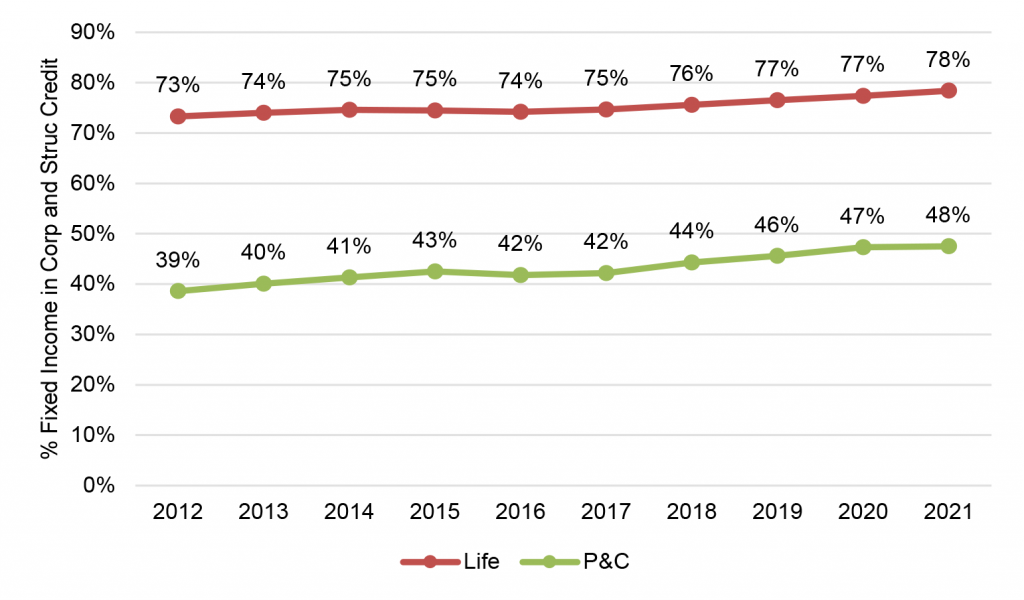
Source: CreditSights, all rights reserved, Amherst Pierpont Securities
Insurer holdings also increasingly are private—either 144A or other forms of unregistered securities. Life portfolios entered the year with nearly 40% of investments in private securities, and P&C portfolios with nearly 20% (Exhibit 4). This partly reflects the aggressive growth of private credit in general in the US, partly as banks have reigned in credit in some areas, partly as private lenders have offered more flexible terms and partly as investors have increasingly given up liquidity for yield.
The growing role of private equity in insurance has also driven up private holdings. More than 10% of insurer assets sit in portfolios with PE sponsors, according to CreditSights, assuming pending deals close. PE sponsors tend to raise portfolio exposure to structured credit and private securities as part of a strategy to lift portfolio yield. Competing insurers then come under pressure to match the strategy or risk falling behind the PE-sponsored players in the policy features or low premiums allowed by higher portfolio yield.
Exhibit 4: Private securities make up a rising share of insurer holdings
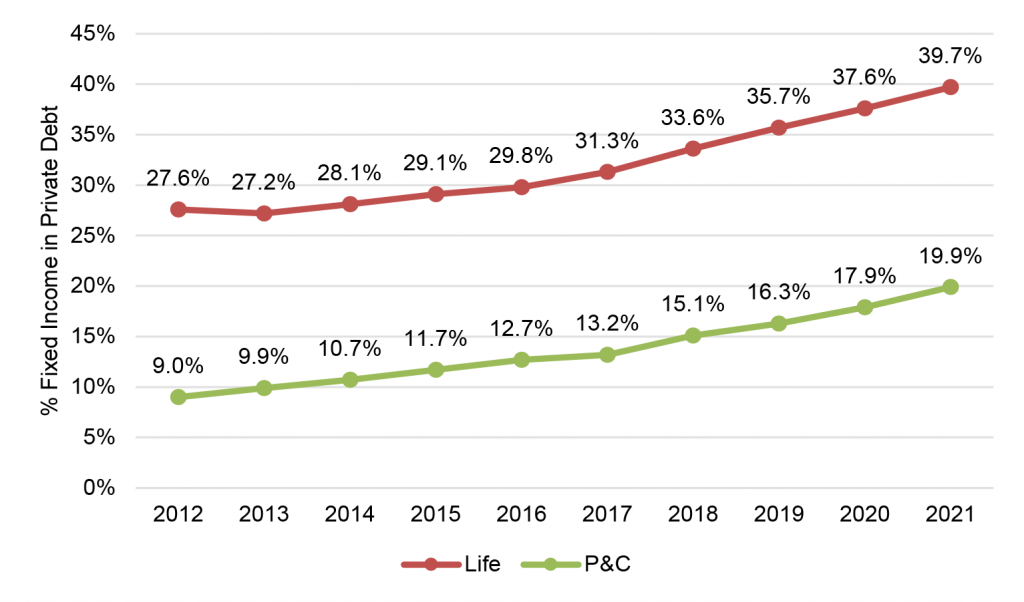
Source: CreditSights, all rights reserved, Amherst Pierpont Securities
High rates are more likely to help insurers than hurt. Managers will be able to invest new money and reinvest old money at higher yields for higher profits. Higher yields reduce the likelihood of drawing on capital and reserves to cover liabilities to policyholders. And higher yields allow insurers to offer products with better features, lower premiums or some combination.
Insurers almost certainly have felt some ill impact of higher rates this year, mainly in any holdings in MBS. MBS durations have extended this year. The duration of the Bloomberg/Barclays MBS index from early January to today has moved from 4.76 years to 5.94 years. The longer duration may leave some insurer portfolios mismatched against liabilities with a net loss of value. But MBS for most portfolios is a small part of the mix, and the unhedged duration is also likely to be small.
Generally good asset-liability management and limited exposure to negatively convex assets leaves insurers among the stronger portfolios in the market. The Fed is heading toward the exits, banks are wrestling with slowing deposit growth and historic unrealized losses on available-for-sale securities, and money managers are seeing steady redemptions. The markets where insurers play are likely to see relatively better liquidity and performance based in part on support from a strong insurer hand.
* * *
The view in rates
Yields continue to rise, with yields on the long end of the curve clearly defying expectations here. Fair value at 10-year and longer maturities still look solidly in the neighborhood of 2.50%, but market implied 10-year inflation remains high. The curve still should invert significantly over the next year with 2-year rates approaching 3.5%. Persistent supply and trade frictions from Russia-Ukraine could force the Fed to go higher than currently priced and push the 2-year note well above current forward rates.
The Fed’s RRP balances closed Friday at $1.86 trillion. The supply of Treasury bills continues to come down, and money market funds have little alternative but to put proceeds into RRP.
Settings on 3-month LIBOR have closed Friday at 137 bp, up 8 bp in the last week. Setting on 3-month SOFR have drifted up to 118 bp, up 4 bp in the last week.
The 10-year note has finished the most recent session at 3.13%, up 20 bp in a week. Breakeven 10-year inflation finished the week at 286 bp, down 8 bp on the week. The 10-year real rate finished the week at 28 bp, up 28 bp on the week. This is the first positive real 10-year rate since early 2020. Real rates increasingly anticipate an aggressive Fed will drain the system of an overhang of cash supply.
The Treasury yield curve has finished its most recent session with 2s10s at 39 bp, 17 bp steeper on the week, and 5s30s at 15 bp, steeper by 11 bp on the week.
The view in spreads
Spreads still look broadly biased to widen in both MBS and credit. Nominal MBS spreads will probably have to trade wider than the average investment grade corporate issue before it becomes compelling relative value for total return investors. Of the major spread markets, corporate and structured credit is likely to outperform, as it has generally since March 2020. Corporates benefit from strong corporate fundamentals and from buyers not tied to Fed policy—especially insurers. The credit markets have a diversified base of buyers while the only net buyers of MBS during pandemic have been the Fed and banks.
The view in credit
Credit fundamentals look strong for now but will almost certainly soften later this year as the Fed dampens demand and growth begins to slow. Russia-Ukraine should have limited direct impact on either the US corporate or consumer balance sheet. Corporations have strong earnings, good margins, low multiples of debt to gross profits, low debt service and good liquidity. It will be important to watch inflation and see if costs begin to catch up with revenues. A higher real cost of funds would start to eat away at highly leveraged balance sheets with weak or volatile revenues. Consumer balance sheets look strong with rising income, substantial savings and big gains in real estate and investment portfolios. Homeowner equity jumped by $3.5 trillion in 2021, and mortgage delinquencies have dropped to a record low.