


The Big Idea
A consumer puzzle
Stephen Stanley | May 20, 2022
This document is intended for institutional investors and is not subject to all of the independence and disclosure standards applicable to debt research reports prepared for retail investors.
The stellar condition of household balance sheets after saving a substantial portion of generous federal support during pandemic is almost old news. However, consumer credit has surged this year. This has led a number of commentators to argue that the consumer is tapped out and borrowing rapidly to sustain spending in the face of high inflation. Soon, the argument goes, it will lead to a sharp slowdown in consumption and, in turn, economic growth. In my view, the situation for households is far less dire.
Households still loaded with liquid assets
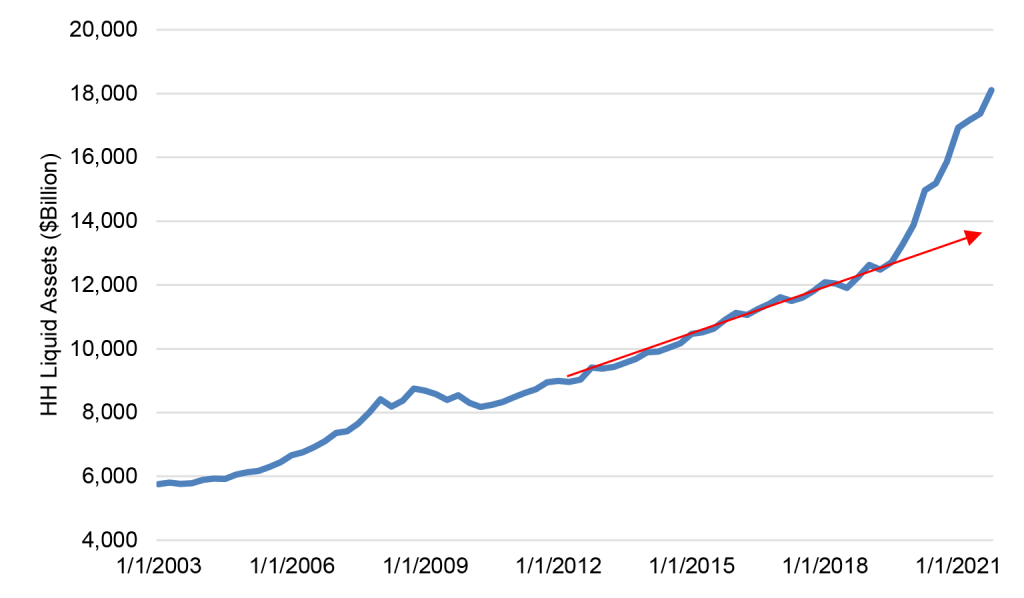
Households are sitting on a massive pile of liquid assets. The total of bank accounts and money market fund holdings surged throughout the pandemic, and by the end of last year exceeded the uptrend established in the decade prior to the pandemic by a whopping $3 trillion to $4 trillion (Exhibit 1).
Exhibit 1: A surge through pandemic in household liquid assets
Source: Federal Reserve.
The reading for the first quarter will not come in until next month, but there is little chance that consumers burned through $4 trillion of savings in a few months. There is one check on how at least the largest chunk of household liquid assets have evolved so far this year. Federal Reserve H.8 data on bank balance sheets show that bank deposits other than time deposits have risen at a relatively slow rate in the first four months of 2022 but are still up by $137 billion. While this is not a perfect proxy—for example, it may include some non-household deposits—it offers enough information to confirm that households have not likely been drawing down their savings at a rapid pace.
Quandary
If households are sitting on trillions of dollars of savings that, up to very recently, was earning little or nothing, then it would make no sense for them to be running up substantial amounts of debt, which, in most cases, carry high rates of interest. It is quite surprising that consumer credit has risen rapidly over the past few months.
In particular, consumer credit surged by $38 billion in February and by $53 billion in March. This has led a number of relatively gloomy observers to conclude that the US consumer has burned through their elevated savings and has been forced to resort to a borrowing spree to sustain recent spending growth.
These two facts create a puzzle. What is the consumer up to?
Income and spending
We can start to get a handle on consumer behavior by looking at income and spending. Personal income excluding government transfer payments, which is mainly labor and investment income, increased by $1.41 trillion over the four quarters through March, while personal consumption expenditures rose by $1.7 trillion. The income and spending figures do suggest households began to dip into that massive pile of excess savings early this year.
This makes sense, as we can surmise that one of the reasons households accumulated so much savings over the last two years is that they were willing but unable to spend on a variety of activities, such as travel, dining out, spectator events and so on. As the economy is finally reopening fully, the opportunity to spend on those activities and others that were impeded by Covid will improve.
Reality check
While the Federal Reserve Board’s consumer credit data have been reported for decades, a more recent addition to the available resources on this topic is the New York Fed quarterly Household Debt and Credit Report. This dataset reflects a representative 5% random sample of all individuals with an Equifax credit report. It is not a full census of household borrowing data but reflects a large enough sample to offer an accurate read on trends.
Interestingly, the New York Fed data offer a different picture from the consumer credit numbers. For the first quarter, virtually the entire increase in household debt came in the form of home mortgages, which are excluded from the consumer credit series. The New York Fed numbers suggest that consumer credit excluding home mortgages and home equity loans was roughly flat in the first quarter and was up a modest 4.7% over the past four quarters—less than the rate of inflation.
Consumer credit data
As an introduction, the Federal Reserve Board’s consumer credit data, as noted above, does not include housing-related borrowing because expenditures on housing are classified as investment rather than spending. The major components are revolving and nonrevolving credit. The former mainly includes credit card balances, while the latter primarily consists of student debt and auto loans.
So, that brings us back to the quandary. Why do the Federal Reserve Board’s consumer credit data show such a steep run-up in borrowing in early 2022? I do not have a definitive answer, but I have a few hypotheses.
Inflation. All of the numbers cited in this piece are in nominal terms. As inflation has accelerated, all nominal measures are likely to have accelerated in tandem. Income, spending, and consumer credit outstanding are all undoubtedly rising faster in part as a reflection of more rapid price increases. The income excluding government transfer payments and consumer spending figures referenced above work out to an 8.9% and 11.3% increase, respectively, over the past four quarters. Compared to that, the 7.3% rise in consumer credit outstanding from March 2021 to March 2022 is actually quite restrained.
Rising Auto Sales. The semiconductor crunch in the motor vehicle sector has finally begun to ease a bit early this year. Unit auto sales rose by roughly 10% in the first quarter from the fourth quarter last year, and the April sales tally in unit terms was slightly above the first quarter average. On top of that, as with most other goods and services, vehicle prices have risen significantly. Thus, nominal motor vehicle sales from the retail sales report jumped by 6.3% not annualized in the first quarter from the fourth quarter last year and were up another 2.2% in April.
Within the consumer credit data, the rise in outstanding borrowing from December to March was $107 billion, almost evenly divided between revolving and nonrevolving debt. While student loan debt has been rising at a steady and substantial pace, the acceleration in nonrevolving credit most likely reflects the increase in auto sales.
Credit Card Balances. The $56 billion jump in revolving credit from December to March is the aspect of these data that has sparked worry about the state of the consumer. However, there is less here than meets the eye for two reasons.
First, outstanding credit card balances are calculated on a daily average basis. Many credit card holders use their cards for convenience and pay their bills off each month. Nevertheless, if consumers start booking more trips, going out to dinner more, and generally charging more on their cards, their average daily balances will increase, even if they continue to pay off their bills each month. While I suspect that there are individual households that are tapped out and may be charging up their card balances again, it makes little sense in the aggregate that households would carry outstanding credit card balances, paying double-digit interest charges, while sitting on trillions of savings and checking deposits that are earning next to nothing.
If I am right, then the acceleration in both revolving and nonrevolving debt may actually be a signal of strength in consumer spending rather than a harbinger of future weakness.
In addition, it is worth laying out some context for the revolving credit numbers. The level of outstanding revolving debt plunged at the beginning of the pandemic, both because spending declined and because households used their government benefits to pay down their balances. The level of revolving credit outstanding remained relatively steady throughout 2020 and much of 2021 before finally resuming an uptrend in late 2021, after most federal payments ended and just about the time that inflation began to accelerate. The level, even after surging in early 2022, is only back to the pre-pandemic level in nominal terms, while the CPI is up by 11% from February 2020 to March 2022. Thus, even after the recent jump, credit card borrowing is still sharply lower in real terms compared to pre-pandemic norms.