


The Big Idea
Mutual fund redemptions and relative value
Steven Abrahams | June 24, 2022
This document is intended for institutional investors and is not subject to all of the independence and disclosure standards applicable to debt research reports prepared for retail investors.
Total return portfolios should be the ones to police relative value in markets like the current one where rates, spreads and volatility have upended the usual order. But the group of return players with the most capital to deploy, actively managed mutual funds, are facing the biggest wave of redemptions in decades. Poor returns, heavy exposure to illiquid assets and generally illiquid markets have all made the problem for the funds bigger. And that has left the market without a lot of relative value capital on the beat.
Heavy redemptions
Mutual funds saw the value of debt holdings drop by $477 billion in the first quarter this year, according to the Fed’s latest Financial Accounts of the United States, the result of both redemptions and falling asset values. The loss represented 8.1% of mutual fund debt value at the start of the year. It was the largest absolute and percentage drop since the late 1990s (Exhibit 1). Outflows from bond funds reported by the Investment Company Institute since March suggest the rush to the exits has only intensified. ETFs meanwhile have largely held their debt assets, according to the Fed data. This echoes the experience of the first quarter of 2020 when mutual funds saw debt assets drop by $387 billion even as ETF debt balances rose.
Exhibit 1: Mutual fund debt balances in early 2022 dropped $477 billion or 8.1%
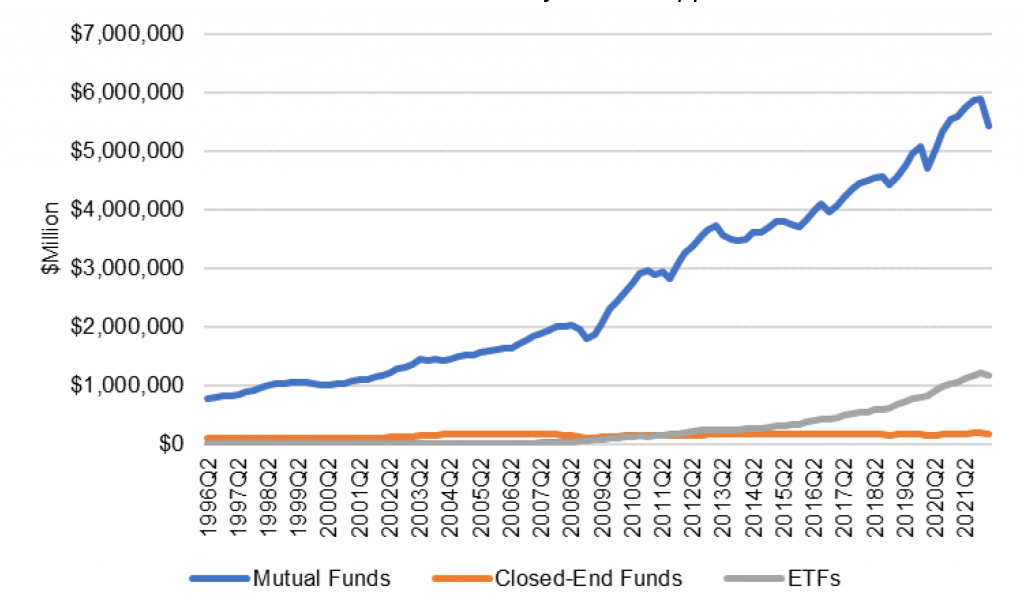
Source: Federal Reserve Financial Accounts of the United States, Table L.208, Rows 44,45 and 46, Amherst Pierpont Securities
A familiar pattern following poor returns
Heavy redemption following poor performance is a familiar problem for actively managed bond funds. Investors in those funds can redeem based on end-of-day net asset value with any portfolio adjustments needed to fund the redemption or restock cash coming in the days afterwards. In portfolios holding illiquid assets, the cost of funding redemptions or restocking cash rises as the most liquid holdings get sold first and less liquid holdings get sold later. This gives investors incentives to hit the exits first, with incentives growing as performance, market liquidity or asset liquidity get worse.
Work led by Itay Goldstein at the University of Pennsylvania’s Wharton School shows investor redemptions from bond funds get heavier as expected when performance suffers, when a fund portfolio holds relatively illiquid assets or when market liquidity gets worse. This does not tend to happen in general for equity mutual funds because of that market’s deeper liquidity, Goldstein finds, although equity funds with illiquid positions show signs of the pattern. And it does not tend to happen for bond or equity ETFs since there is no redemption mechanism to create incentives for an investor run on the fund.
Heavy exposure to illiquid products magnifies the challenge
Poor returns on bond funds this year almost certainly started the current round of redemptions, but fund concentration in relatively illiquid assets has likely magnified the problem. Mutual funds at the end of the first quarter were nearly 19% overweight corporate and structured credit and nearly 10% overweight municipal debt, both relatively illiquid markets (Exhibit 2). Funds at the same time were nearly 10% underweight agency debt and MBS and nearly 19% underweight Treasury debt, both relatively liquid markets. The relatively illiquid holdings have almost certainly prompted heavier-than-usual redemptions and made funding those redemptions relatively expensive.
Exhibit 2: Mutual funds stand overweight illiquid products, underweight liquid
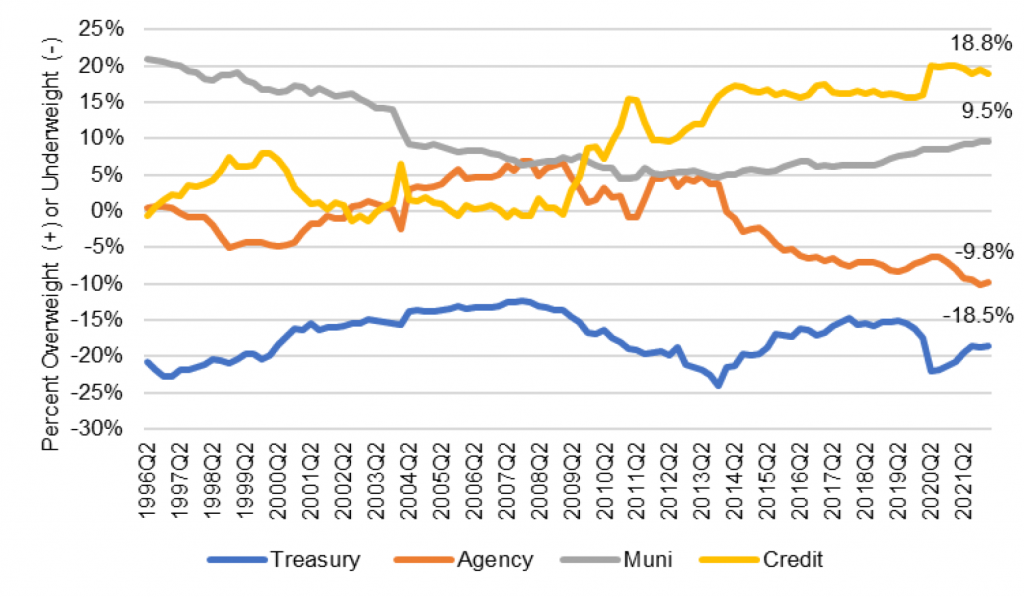
Note: Data reflect a comparison of sector shares of total outstanding debt securities (the index) against sector shares of debt securities held by mutual funds. Holdings come from the Federal Reserve’s Financial Accounts of the United States.
Source: Federal Reserve, Amherst Pierpont Securities.
Generally illiquid markets add to the problem
Adding to the challenges of poor returns and illiquid assets is the rising general illiquidity of markets. Even in the US Treasury market, measures of liquidity show sharp deterioration, with yield differences between competing issues at their widest dispersion in the last five years outside of March 2020 (Exhibit 3). The Fed’s latest Senior Credit Officer Opinion Survey on Dealer Financing Terms also finds clear deterioration in liquidity in the Treasury and agency MBS markets, and signs of poorer liquidity in investment grade corporate debt and CMBS. General illiquidity adds another toll on the road to funding redemptions.
Exhibit 3: Liquidity even in the Treasury market has sharply deteriorated
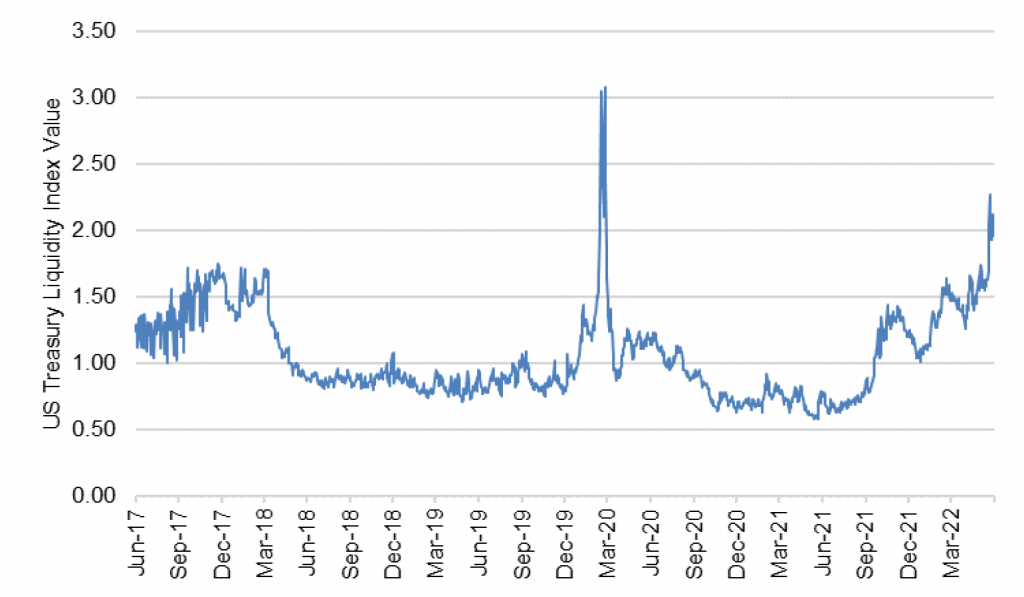
Note: The index reflects the average difference in yield between US Treasury issues with a 1-year or longer maturity and the intra-day Bloomberg relative value curve fitter. In liquid markets, deviations go away quickly, and index values are low. In illiquid markets, deviations persist, and index values are high.
Source: Bloomberg, Amherst Pierpont Securities.
Relative value in some parts of the debt markets has become ripe for the picking, although some of the widest spreads are in the least liquid parts of the market including CLOs, CRE CLOs, conduit CMBS and similar assets. New deals oversubscribed multiple times a few months ago now barely clear the market. With some of the biggest total returns portfolios anecdotally guarding their liquidity closely, the wide and volatile spreads in some of these sectors suggest little capital willing to step in and buy.
If poor returns started the current round of mutual fund redemptions, then good returns may be the thing to reverse the flows. Broad market returns have improved since mid-June as rates have dropped. But it will likely take more time with stable or lower rates and stable or tighter spreads before the relative value cops are back on the beat.
* * *
The view in rates
The University of Michigan’s survey of consumer inflation expectations showed Friday that the Fed has work to do to knock expectations off some of the highest levels since 2008. The Fed should push funds close to 4% by early next year, which should invert the yield curve. The 2-year rate should approach 3.5%. Fair value at 10-year and longer maturities still looks solidly in the neighborhood of 2.50%, but the possibility of a sustained fight with inflation may require compensation above fair value even in long maturities.
Fed RRP balances closed Friday at $2.18 trillion after peaking at a record $2.28 trillion on Thursday. The supply of Treasury bills continues to come down, with bills trading at yields below the RRP’s current 1.55% rate out to early September. Money market funds have little alternative but to put proceeds into RRP.
Settings on 3-month LIBOR have closed Friday at 220 bp. Setting on 3-month term SOFR closed Friday at 201 bp.
The 10-year note has finished the most recent session around 3.13%, almost unchanged from mid-June. Breakeven 10-year inflation finished the week at 257 bp, down 22 bp from mid-June The 10-year real rate finished the week at 56 bp, up 20 bp since mid-June. The bounce in real yields implies the market expects a much more aggressive Fed.
The Treasury yield curve has finished its most recent session with 2s10s at 7 bp and 5s30s also at 7 bp.
The view in spreads
The equilibrium between MBS and credit looks ripe for change. Nominal MBS spreads incorporate big components of the risks that faced the sector at the start of the year—the Fed path, balance sheet normalization, the risk of MBS sales. Credit spreads seem insufficient to cover the spread volatility likely as growth slows and concern about recession grows. The turning point is here, and after nearly two years of better performance in credit, the tide should start to turn toward MBS.
The view in credit
Credit fundamentals look good for now but will almost certainly soften later this year as the Fed dampens demand and growth begins to slow. In some quarters, the conversation has turned from whether recession will arrive to the shape of recession once it does. Corporations have strong earnings for now, good margins for now, low multiples of debt to gross profits, low debt service and good liquidity. It will be important to watch inflation and see if costs begin to catch up with revenues. A higher real cost of funds would start to eat away at highly leveraged balance sheets with weak or volatile revenues. Consumer balance sheets look strong with rising income, substantial savings and big gains in real estate and investment portfolios. Homeowner equity jumped by $3.5 trillion in 2021, and mortgage delinquencies have dropped to a record low. But inflation and recession could take a toll and add credit risk to consumer balance sheets.