


The Big Idea
Mispricing the Fed put
Steven Abrahams | July 8, 2022
This document is intended for institutional investors and is not subject to all of the independence and disclosure standards applicable to debt research reports prepared for retail investors.
Through the back half of June and into July, the market has flip-flopped on its expectation of recession and Fed response to it. First the Fed has to tighten, and then ease. If this were 2008 or 2018 or 2020, a quick Fed rescue would be the right expectation. In those earlier crises, the Fed put a floor on how much damage it would tolerate to the economy and markets. But this time the market looks likely to be wrong. The difference now is inflation and the Fed’s determination to beat it even, if need be, at the cost of recession. The market has mispriced the Fed put, and correcting that mispricing should affect rates, volatility and spreads.
Forward rates and other parts of the markets show a market going back and forth on its expectations for fed funds. In late June the market expected fed funds to peak early next year at 3.52% and then fall 80 bp in the following two years (Exhibit 1). By July 6, the market expected a 3.32% peak and 100 bp of subsequent easing. On Friday, the market closed with expectations back at 3.52% and slightly less than 100 bp of easing. The leg up traces the Fed path needed to beat inflation, and the leg down the rescue needed to avoid recession. Funds end five year out between 2.50%, where the Fed for now has planted the flag for neutral rates, and 2.80%. The steeper the decline from the peak, the more value the market assigns to the Fed put.
Exhibit 1: The market has flipped-flopped on expected Fed tightening, easing
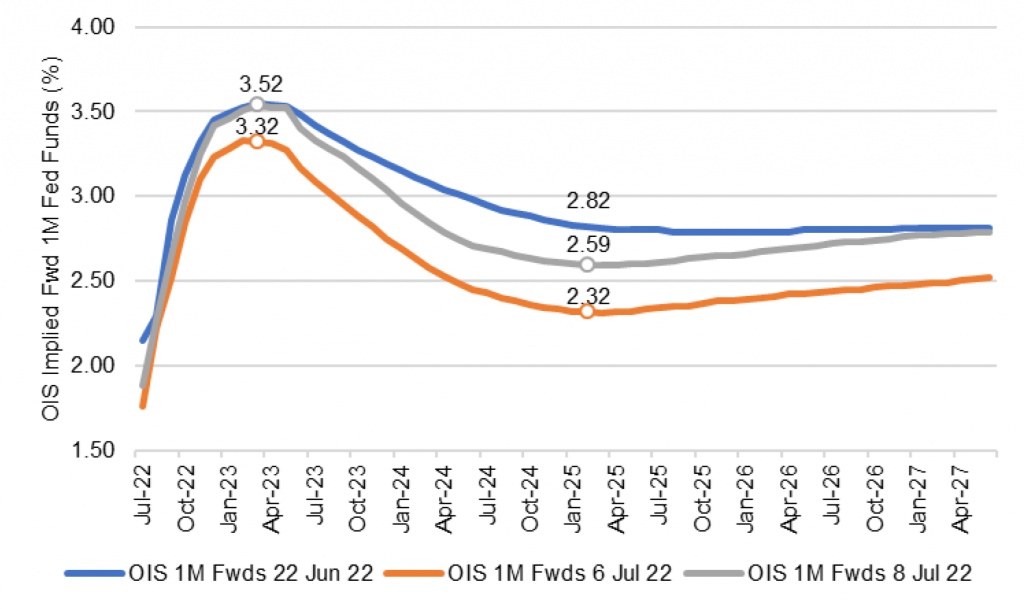
Note: Forward implied 1-month OIS rates as of 7/6/22. Source: Bloomberg, Amherst Pierpont Securities
There is healthy uncertainty about this path judging just from the rapid repricing. The options markets reflect all the ways the Fed might need to recalibrate along the way. Implied volatility is as high as it was in March 2020 when the global economy began to shut down but before the Fed and the federal government rolled out their pandemic safety nets (Exhibit 2). Consider the forces now in play: Fed action, the response in the economy, and the response in a market that has worked for the Fed for most of the year by pushing up rates and widening spreads but could work against the Fed by anticipating quick easing. If the market does the Fed’s work by tightening financial conditions, the Fed may be able to hike less. But if the market thinks the Fed may pull up short, it could loosen conditions and require the Fed to go further. It’s a hall of mirrors or, more specifically, a hall of expectations.
Exhibit 2: Implied rate volatility has nearly matched the onset of pandemic
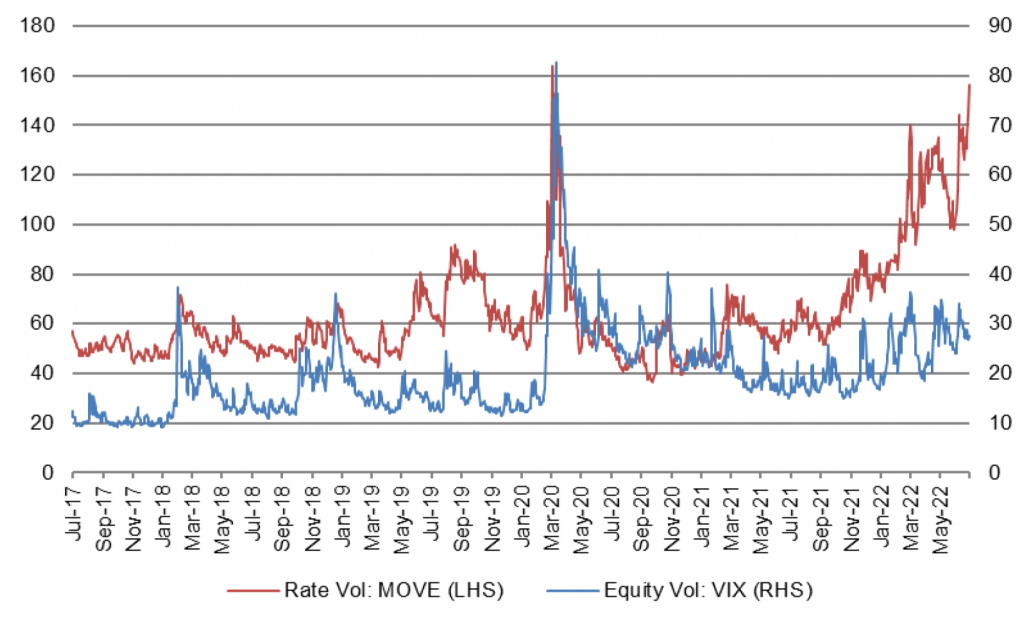
Source: Bloomberg, Amherst Pierpont Securities
Note two telling items from the June FOMC minutes, pointed out by my colleague, Stephen Stanley:
…Participants concurred that the economic outlook warranted moving to a restrictive stance of policy, and they recognized the possibility that an even more restrictive stance could be appropriate if elevated inflation pressures were to persist….
…Many participants judged that a significant risk now facing the Committee was that elevated inflation could become entrenched if the public began to question the resolve of the Committee to adjust the stance of policy as warranted….
It has always been about both actual and expected inflation. The Fed presumably and the market almost certainly will need to see wins on both fronts, with both actual and expected inflation back in the neighborhood of the Fed’s 2% target. On the expectations front, it looks like the Fed is winning. The TIPS market in the last few weeks has repriced implied inflation much lower with the 5-year forward 5-year implied inflation rate closing Friday at 2.10% (Exhibit 3). Those expectations have to rely entirely on confidence in the Fed’s ability and willingness to beat inflation despite definitive evidence so far. The more difficult, actual inflation part is still ahead.
Exhibit 3: Implied inflation has dropped sharply
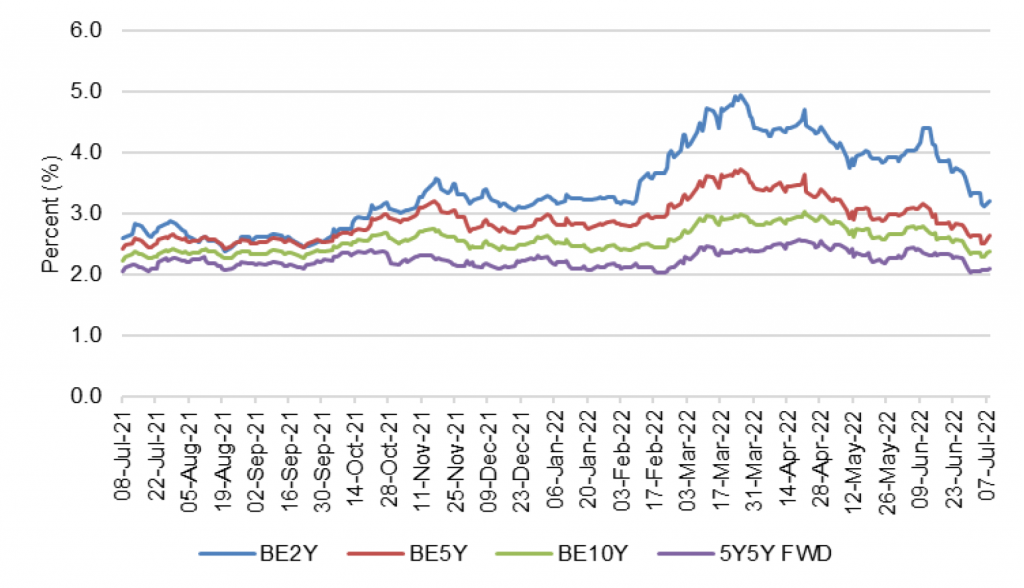
Source: Bloomberg, Amherst Pierpont Securities
Plenty of things suggest the arc of actual inflation should bend down in the next few months, which the market should initially take as a sign Fed policy and normal economic adaptation are working. Commodity prices are down, supply bottlenecks are easing, housing is cooling. But note another recent remark from Fed Chair Powell:
What [the Fed] can control is demand. We can’t really affect supply with our policies. So the question whether we can execute a soft landing or not, it may actually depend on factors that we don’t control.
A large part of the current inflation problem—based on estimates from the San Francisco Fed, nearly half of it—is due to supply constraints rather than demand. The Fed may ultimately need to reduce demand sharply to align with potential supply. The Fed doesn’t yet know the impact of its policy and seems unlikely to back off until it sees definitive evidence that realized inflation is heading back to target. And here is where central bank orthodoxy comes in.
Central bankers have long seen stable prices as their most basic, fundamental responsibility, even the Fed despite its dual mandate. Fed speakers have long argued that stable prices lead to full employment. The order is clear. There’s a strong case that price stability is the only thing a central bank can control. A credible central bank will push the economy into recession—even into deep recession, if necessary—to beat inflation. It’s better to get blamed for recession than inflation, better to be Paul Volcker than Arthur Burns.
The market looks well priced for fed funds on the way up but too eager to price in easier Fed policy. The path to lower realized inflation is highly uncertain, and the Fed looks likely to err on the side of tighter rather than looser policy.
For the market, a Fed biased to staying tighter rather than looser has a few implications:
- The curve needs to continue inverting substantially between 2- and 10-year rates, the former reflecting terminal fed funds holding for longer than the market prices now
- Rate volatility looks likely to hold at current high levels or go higher, reflecting unknowns about the Fed, the economy and the market unlikely to get resolved until the actual path of inflation becomes clearer in early 2023
- Higher volatility should keep nominal spreads in credit and MBS wide or push them wider, although credit is likely to underperform as growth slows and prospects of recession rise
This kind of market makes it hard to invest for most portfolios. Volatility has created clear relative value in agency MBS, private CMBS, CLOs, CRE CLOs and other areas. But taking advantage depends on the type of portfolio. A few ideas:
- Portfolios investing for absolute return. Buy assets with relative value but hedge out as much risk as possible. Returns in this situation start to look like cash or short-duration assets. But the portfolio ends up long good assets rather than trying to chase them as volatility begins to resolve, and lifting hedges is usually easier than finding relative value.
- Benchmarked portfolios. Allocate out of illiquid toward liquid assets. Opportunity will require flexibility, which is what liquidity buys.
- Bank portfolios. Barbell cash and 10-year assets so the cash yield will ride up with fed policy rates and the 10-year generate gains if yields at the long end hold or go lower.
- Insurance portfolios. Built for illiquid markets. There may be better opportunity as the market figures out the Fed, but not much better. Stay fully invested.
* * *
The view in rates
The 5.1% year-over-year gain in average hourly earnings reported Friday gives further reason for Fed concern. The Fed should push funds close to 4% by early next year, which should invert the yield curve. The 2-year rate should approach 3.5%. Fair value at 10-year and longer maturities still looks solidly in the neighborhood of 2.50%, but the possibility of a sustained fight with inflation may require compensation above fair value even in long maturities.
Fed RRP balances closed Friday at $2.14 trillion. The supply of Treasury bills continues to come down, with bills trading at yields below the RRP’s current 1.55% rate out to late August. Money market funds have little alternative but to put proceeds into RRP.
Settings on 3-month LIBOR have closed Friday at 242 bp. Setting on 3-month term SOFR closed Friday at 224 bp.
The 10-year note has finished the most recent session around 3.08% after starting the trading week at 2.81%. Breakeven 10-year inflation finished the week at 237 bp. The 10-year real rate finished the week at 71 bp. The bounce in real yields implies the market expects an aggressive Fed.
The Treasury yield curve has finished its most recent session with 2s10s at -3 bp and 5s30s at 12 bp.
The view in spreads
MBS should outperform credit as the Fed tightens and growth slows. Nominal MBS spreads have widened to 140 bp to reflect the Fed path, volatility, balance sheet normalization and the risk of MBS sales. MBS OAS, on the other hand, has been slowly tightening, suggesting good net demand. Credit spreads seem insufficient to cover the spread volatility likely as growth slows and concern about recession grows. After nearly two years of better performance in credit, the tide should start to turn toward MBS.
The view in credit
Credit fundamentals should soften later this year as the Fed dampens demand and growth begins to slow. In some quarters, the conversation has turned from whether recession will arrive to the shape of recession once it does. Corporations have strong earnings for now, good margins for now, low multiples of debt to gross profits, low debt service and good liquidity. It will be important to watch inflation and see if costs begin to catch up with revenues. A higher real cost of funds would start to eat away at highly leveraged balance sheets with weak or volatile revenues. Consumer balance sheets look strong with rising income, substantial savings and big gains in real estate and investment portfolios. Homeowner equity jumped by $3.5 trillion in 2021, and mortgage delinquencies have dropped to a record low. But inflation and recession could take a toll and add credit risk to consumer balance sheets.