


The Big Idea
Banks pivot, markets shift
Steven Abrahams | July 29, 2022
This document is intended for institutional investors and is not subject to all of the independence and disclosure standards applicable to debt research reports prepared for retail investors.
In the last few months, banks have started to turn their collective $23 trillion balance sheet from securities to loans. Securities portfolios effectively stopped growing in April and loan portfolios started growing at a pace not seen in years. Pressure from a rising deposit base to invest quickly, often in securities, also basically stopped. The pivot has reshaped capital markets, taking out the bank bid for securities and even anecdotally diverting assets from securitizations and into bank loan portfolios. Banks almost certainly have other things to do in the capital markets, but the most recent quarter is likely prologue to several more of weak net securities demand.
A sudden pivot from securities to lending
Banks have watched balance sheet liquidity rise steadily through most of pandemic, but suddenly the tide has turned. Lending has almost entirely replaced securities and cash assets as banks’ favored use of funds. Securities balances, which had grown at annualized quarterly rates between 11% and 26% since at least early 2021, effectively stood still starting in April (Exhibit 1). Balances in cash assets dropped nearly 38% as banks continued pulling reserves out of the Fed. And lending rose at the fastest pace since at least early 2021 with C&I balances up at an annualized quarterly rate of 16.3%, consumer loans up 13.5% and mortgage and other real estate loans up 9.4%.
Exhibit 1: Growth in different types of bank assets swung sharply in 2Q22
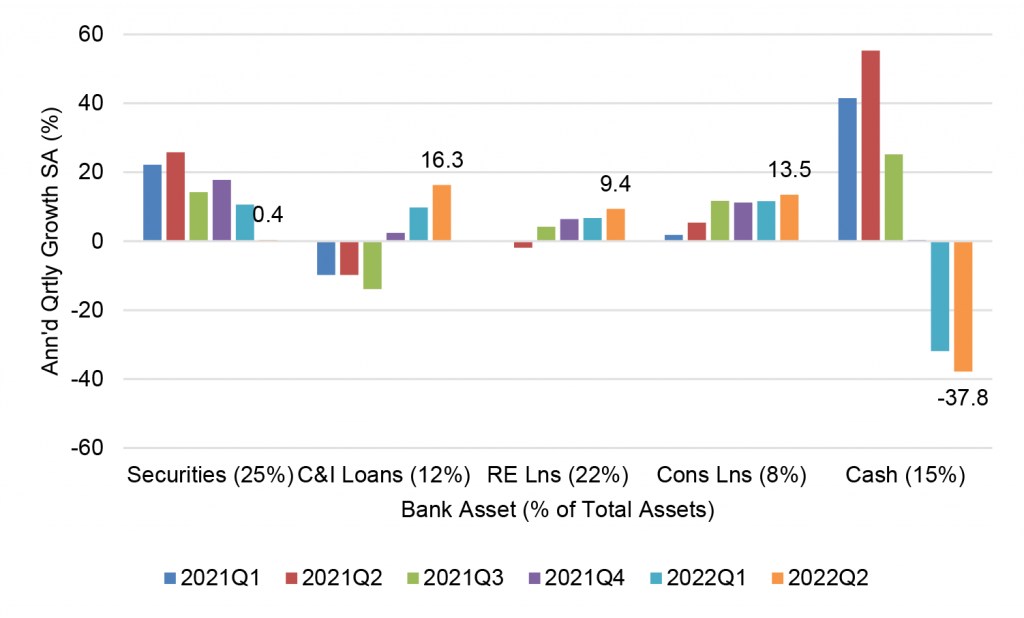
Source: Federal Reserve H.8, Amherst Pierpont Securities
The bank pivot has almost certainly reshaped both demand and supply in debt capital markets. Banks slightly reduced balances in agency MBS from April through June while slightly increasing balances in US Treasury and agency debt. The indifferent appetite for securities marks a major shift from the last few years. Banks in 2021, for instance, were the single largest net buyer of agency MBS—buying even more than the Fed—and the third largest net buyer of Treasury debt. The pivot to loans has almost certainly absorbed supply into loan portfolios that might have otherwise turned up in securitizations. Anecdotally, a number of mortgage originators that seeded prime jumbo securitizations last year have been selling most of their loans to bank portfolios. Aggressive bank levels on middle market loans also reportedly have taken deals from nonbank lenders that use middle market CLOs for financing. And aggressive levels on bank CLO warehouse lines have created strong financial incentives for CLO managers to stay in the warehouse and wait for tighter primary market spreads. In some cases, securities trade at higher yields than comparable bank loans, although banks may argue the loans bring other fees or lending opportunities.
Less pressure from the liability side to grow quickly
The pivot from securities to lending comes as banks find themselves under less pressure to invest a heavy flow of deposits. Deposit growth from April through June slowed to 1.2%, the lowest annualized quarterly rate since early 2021, and wholesale borrowings dropped by 3.3% (Exhibit 2). Much faster deposit growth in past quarters often pressured banks to invest in securities, which banks usually can source much faster than loans. Slower growth may no longer be forcing banks’ hand and may align better with the flow of lending.
Exhibit 2: Bank deposit growth slowed, and borrowings dropped
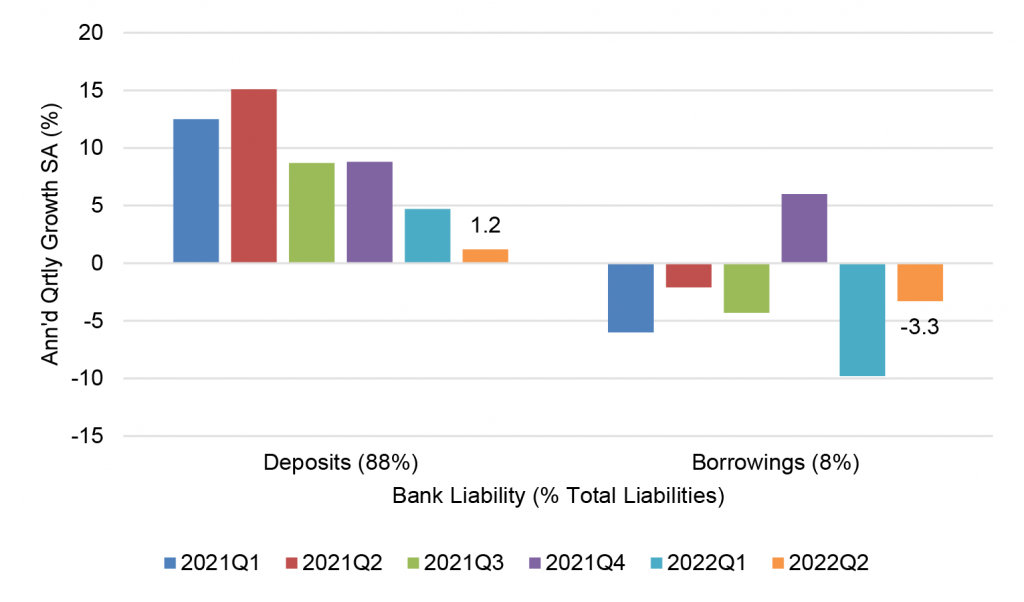
Source: Federal Reserve H.8, Amherst Pierpont Securities
Puzzling out the path of pivot
The surge in loan growth does not line up well with the two recent quarters of shrinking US real GDP, much as our Chief Economist Stephen Stanley points out the recent strong labor market does not line up with shrinking real GDP. Loan growth should roughly track real GDP in the long run since GDP needs to cover the cost of the supporting debt and equity. Current consensus forecasts call for real growth to glide toward 1% by mid-2023 before starting to rise. On the other hand, inflation has helped lift nominal corporate profits, so companies may be willing to borrow nominal dollars to get higher nominal profits. In that case, loan demand should track inflation and nominal GDP, which seems to be the case in recent quarters. If that is the best indicator, then good loan demand should persist as long as high inflation. And Inflation looks increasingly sticky and likely to come down slowly and only after aggressive Fed tightening.
Past is prologue
For the markets, the last quarter looks like prologue to several more quarters of light bank demand for securities, strong demand for lending and little pressure from the deposit base to get funds invested quickly. That does not mean banks will go absent from the debt capital markets. As our Bank Strategist Tom O’Hara points out this week, banks look likely to shift their mix of securities more heavily toward Ginnie Mae MBS and other 0% risk-weighted assets, use more interest rate derivatives to manage balance sheet duration ahead of possible recession, and go to the FHLBanks and the capital markets for wholesale funding. The last quarter shows the balance sheet needs of banks have changed, and the markets will almost certainly have to change, too.
* * *
The view in rates
The 2-year note for now looks like it is tremendously rich while the 10-year note looks like it is in the neighborhood of fair value. The 2-year rate should approach 3.5% assuming a Fed more concerned about inflation than recession. Fair value at 10-year and longer maturities still looks solidly in the neighborhood of 2.50%, but the possibility of a sustained fight with inflation may require compensation above fair value even in long maturities. That makes the 2-year note at a 2.88% yield rich, and the 10-year note at a 2.65% yield roughly fair.
Fed RRP balances closed Friday at $2.3 trillion, the highest print since the end of June. Yields on Treasury bills out to early October trade below the current 2.30% rate on RRP cash. Money market funds have little alternative but to put proceeds into RRP.
Settings on 3-month LIBOR have closed Friday at 278 bp, unchanged on the week. Setting on 3-month term SOFR closed Friday at 254 bp, down 2 bp on the week.
The 10-year note has finished the most recent session around 2.65%, down 12 bp on the week. Breakeven 10-year inflation finished the week at 255 bp, up 21 bp from a week before. The 10-year real rate finished the week at 10 bp, down 33 bp on the week.
The Treasury yield curve has finished its most recent session with 2s10s at -24 bp, inverted another 3 bp on the week. The 5s30s finished the most recent session at 33 bp, steeper by 21 bp on the week.
The view in spreads
Although persistent volatility should make it hard for risk spreads to tighten, MBS should outperform credit as the Fed tightens and growth slows. Nominal par 30-year MBS spreads to the blend of 5- and 10-year Treasury yields finished the most recent session at 115 bp, tighter by 21 bp on the week. At this point, those spreads reflect the Fed path, volatility, balance sheet normalization and the risk of MBS sales. MBS OAS, on the other hand, continues to slowly tighten, suggesting good net demand. Par 30-year MBS OAS finished the week at 8 bp, tighter by 18 bp on the week. Credit spreads seem insufficient to cover the spread volatility likely as growth slows and concern about recession grows. After nearly two years of better performance in credit, the tide should start to turn toward MBS.
The view in credit
Credit fundamentals should soften as the Fed dampens demand and growth begins to slow. In some quarters, the conversation has turned from whether recession will arrive to the shape of recession once it does. Corporations have strong earnings for now, good margins for now, low multiples of debt to gross profits, low debt service and good liquidity. It will be important to watch inflation and see if costs begin to catch up with revenues. A recent New York Fed study argues inflation generally helps companies lift gross margins. A higher real cost of funds would start to eat away at highly leveraged balance sheets with weak or volatile revenues. Consumer balance sheets look strong with rising income, substantial savings and big gains in real estate and investment portfolios. Homeowner equity jumped by $3.5 trillion in 2021, and mortgage delinquencies have dropped to a record low. But inflation and recession could take a toll and add credit risk to consumer balance sheets.