


The Big Idea
Summer camps
Steven Abrahams | August 5, 2022
This document is intended for institutional investors and is not subject to all of the independence and disclosure standards applicable to debt research reports prepared for retail investors.
The market has split into two camps this summer. Camp Inflation believes the Fed will need to fight persistent inflation at all costs. Camp Growth believes the Fed will pull up short if growth suffers too much. For now, Camp Growth looks like it is winning the tug-o-war based on fed funds futures showing a tighter Fed into early 2023 and an easier one shortly afterwards. But Camp Inflation looks right. And that is a recipe for rate and spread volatility, raising the cost of holding and rebalancing risk. Market liquidity is showing the effects.
The Fed in the last week has tried to rally Camp Inflation:
- “I think we’re going to have to see convincing evidence across the board—headline and other measures of core inflation all coming down convincingly—before we’ll be able to feel like we’re doing enough and we’re doing a good job.” – James Bullard, FOMC voter and president of the St. Louis Fed, on August 3 after calling for fed funds of 3.75% to 4.00% by the end of this year.
- “We’re committed to getting inflation down.” – Loretta Mester, FOMC voter and president of the Cleveland Fed, on August 4, after restating the Fed’s 2% inflation target and arguing for more rate increases.
- “Nowhere near done.” – Mary Daly, San Francisco Fed president, on August 2, commenting on the path from current policy rates to a Fed pause.
These remarks echo Fed Chair Powell’s suggestions that stable prices could come at the cost of recession and rising unemployment.
Camp Growth isn’t buying it, even after Friday’s release of June’s 528,000 in new jobs. Implied forward fed funds finished Friday showing a peak rate of 3.63% in March next year, with the rate dropping to 3.04% by the end of the year.
Exhibit 1: Implied fed funds see a tighter Fed into early 2023, easier afterwards
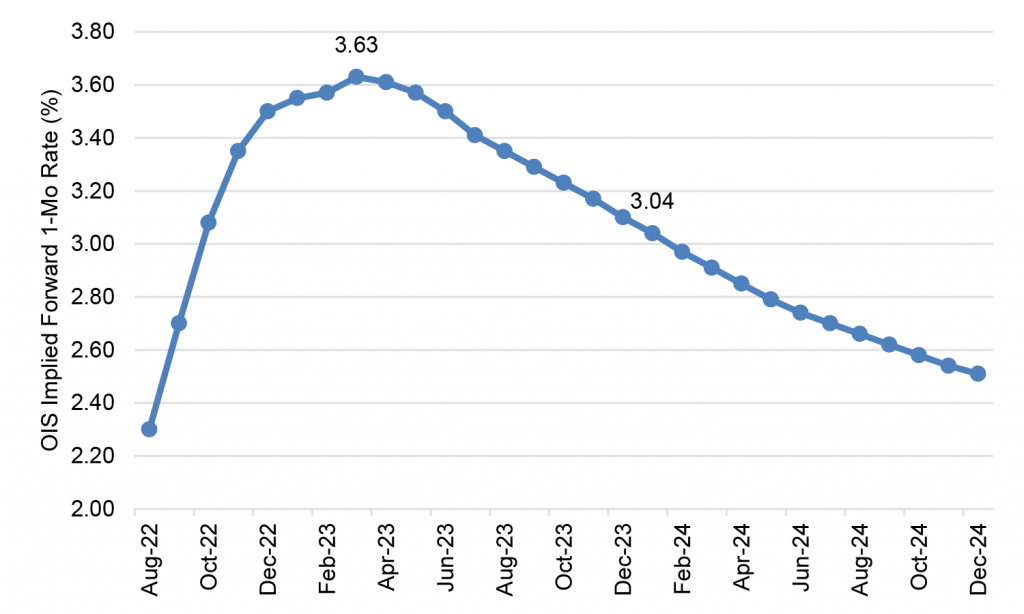
Note: 1-month forward rates from the 8/5/2022 closing OIS curve.
Source: Bloomberg, Amherst Pierpont Securities
The current implied path of fed funds only makes sense if the Fed pivots to focus on slower growth or if inflation collapses. The Fed’s concern about growth in 2008, in 2018 and in 2020 feed Camp Growth’s faith that the Fed will pivot. But the Fed in those episodes had inflation well under control and could afford to pivot. That is not the case this time. Inflation is broad and looks persistent with momentum behind rising prices especially for shelter and labor. Falling prices for food and energy could bring headline CPI down in short order, but core and PCE look unlikely to tumble.
A flow of contradictory information—payrolls and inflation readings rallying Camp Inflation, GDP rallying Camp Growth—have pushed realized and implied volatility up and made it difficult to hold and rebalance risk. Liquidity has eroded in the Treasury market (Exhibit 2). It has eroded, too, in MBS and in investment grade corporate debt, too. Lower trading volumes, wider bid-ask and more price sensitivity to large flows have raised the cost of responding to new information and added risk to the markets.
Exhibit 2: Treasury liquidity is closing in on March 2020 levels
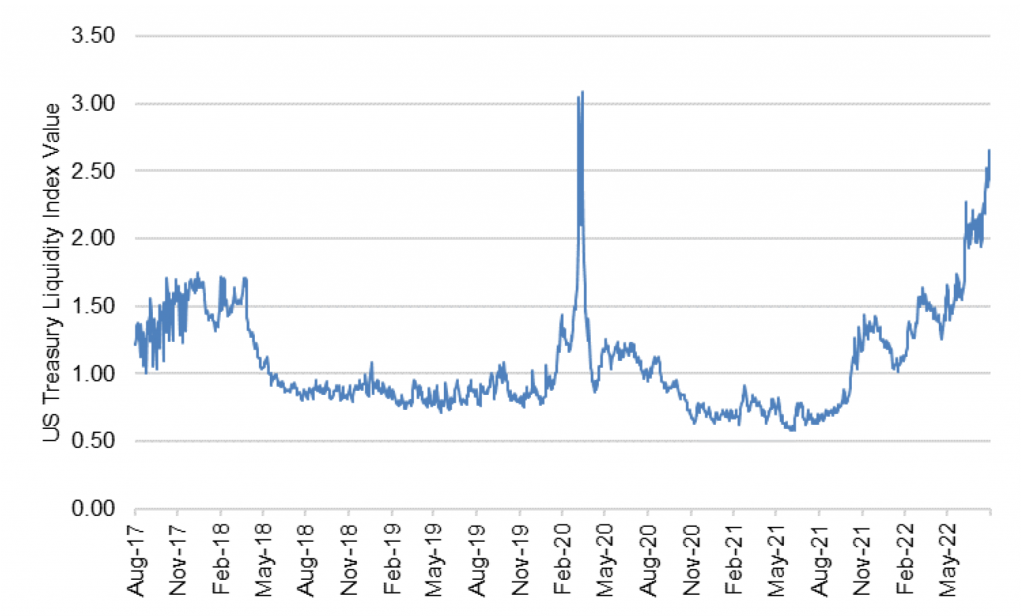
Note: The index reflects the average difference in yield between US Treasury issues with a 1-year or longer maturity and the intra-day Bloomberg relative value curve fitter. In liquid markets, deviations go away quickly, and index values are low. In illiquid markets, deviations persist, and index values are high.
Source: Bloomberg, Amherst Pierpont Securities.
The only portfolios with reliable appetite seem to be those insulated from mark-to-market risk. Insurers continue to invest steadily and the lending side of banks continue to grow at the fastest pace in years.
For the public markets to regain their footing, the tug-o-war between Camp Inflation and Camp Growth has to get resolved. There’s a good chance that will happen this fall, nearly six months after the Fed’s first hike. At that point, the two camps on either end of the rope will see the long and variable effects of Fed policy. If inflation persists, the market should reprice rates even higher in the front of the curve. If inflation starts to fall, intermediate rates should start to fall. In either case, volatility should start to drop and risk assets should get a reliable bid again.
* * *
The view in rates
Even though the 2-year note closed Friday at 3.23%, it still looks rich while the 10-year note looks like it is in the neighborhood of fair value. The 2-year rate should approach 3.50% assuming a Fed more concerned about inflation than recession. Fair value at 10-year and longer maturities still looks solidly in the neighborhood of 2.50%, but the possibility of a sustained fight with inflation may require compensation above fair value even in long maturities. The 2s10s curve looks likely to invert by around 70 bp before Fed tightening is over.
Fed RRP balances closed Friday at $2.19 trillion, roughly the average since mid-June. Yields on Treasury bills out to early October trade below the current 2.30% rate on RRP cash. Money market funds have little alternative but to put proceeds into RRP.
Settings on 3-month LIBOR have closed Friday at 286 bp. Setting on 3-month term SOFR closed Friday at 263 bp.
The 10-year note has finished the most recent session around 2.83%, up 18 bp on the week. Breakeven 10-year inflation finished the week at 247 bp, down 8 bp from a week before. The 10-year real rate finished the week at 35 bp, up 25 bp on the week.
The Treasury yield curve has finished its most recent session with 2s10s at -40 bp, inverted another 16 bp on the week. The 5s30s finished the most recent session at 11 bp, flatter by 22 bp on the week.
The view in spreads
Persistent volatility should make it hard for risk spreads to tighten, MBS should still outperform credit as the Fed tightens and growth slows. Nominal par 30-year MBS spreads to the blend of 5- and 10-year Treasury yields finished the most recent session at 125 bp, wider by 10 bp on the week. MBS OAS, on the other hand, continues to slowly tighten, suggesting good net demand. Par 30-year MBS OAS finished the week at 12 bp, wider by 4 bp on the week. Credit spreads seem insufficient to cover the spread volatility likely as growth slows and concern about recession grows. After nearly two years of better performance in credit, the tide should start to turn toward MBS.
The view in credit
Credit fundamentals should soften as the Fed dampens demand and growth begins to slow. In some quarters, the conversation has turned from whether recession will arrive to the shape of recession once it does. Corporations have strong earnings for now, good margins for now, low multiples of debt to gross profits, low debt service and good liquidity. It will be important to watch inflation and see if costs begin to catch up with revenues. A recent New York Fed study argues inflation generally helps companies lift gross margins. A higher real cost of funds would start to eat away at highly leveraged balance sheets with weak or volatile revenues. Consumer balance sheets look strong with rising income, substantial savings and big gains in real estate and investment portfolios. Homeowner equity jumped by $3.5 trillion in 2021, and mortgage delinquencies have dropped to a record low. But inflation and recession could take a toll and add credit risk to consumer balance sheets.