


The Big Idea
An update on shelter costs
Stephen Stanley | August 19, 2022
This document is intended for institutional investors and is not subject to all of the independence and disclosure standards applicable to debt research reports prepared for retail investors.
The Dallas Fed published a note roughly a year ago predicting a steep and sustained acceleration in the shelter cost component of the CPI. The piece proved prescient, as rent and owners’ equivalent rent began to accelerate soon thereafter, a key part of the broad-based surge in underlying inflation that began last fall. The researchers recently updated their analysis, which now shows a higher and earlier peak for shelter costs without much relief until the second half of next year. Shelter alone could keep the Fed at peak funds rate into 2024.
Reviewing the model
The BLS measures shelter costs by estimating the cost of the stream of services that a home or apartment provides. This equates more to rents rather than home prices, which include an investment component. However, not every housing unit turns over every month, so the rent and owners’ equivalent rent components of the CPI are correlated to more timely measures like monthly home prices or monthly measures of new signed rent contracts with a lag.
Many, perhaps most, apartment contracts are signed for 12 months. Consider an example where every rental agreement has a 12-month term, with starting dates evenly distributed across each month of the year. Now, imagine that rents double for every housing unit on the same day. A measure of signed rental contracts would immediately show a 100% rise, but the CPI measures would likely rise by about 8.3% for each of the next 12 months—100% divided by 12.
This example illustrates the main reason that the CPI measures, which are also used in the PCE deflator, tend to lag contemporaneous gauges of rents and home prices. The researchers at the Dallas Fed formalized the relationship, running a series of regressions, and determined that rent and OER inflation tend to lag reported home prices by about 12 to 18 months.
As of June last year, the CPI gauges were still running at a benign year-over-hear rate, about 1.9% and 2.3% respectively. The researchers’ model suggested the measures would accelerate to 3.0% and 3.8% respectively by the end of 2022 and quicken further to 6.9% for both at the end of 2023. At the time, many found this result to be shocking, and it ran directly counter to the prevailing narrative coming from the FOMC because it suggested inflation would accelerate and stay high for at least two to three years.
Freshening up the results
While the Dallas Fed model got the direction of shelter costs right, the upward trajectory has actually been far steeper than predicted. Last year’s regressions projected that it would take 18 months just to get up to the 3% vicinity on a year-over-year basis. In reality, we hit the Dallas Fed end-2022 predictions by the end of 2021! Updating the models would therefore shorten the lag between home price gauges and the CPI measures.
In addition, home prices continued to accelerate in the second half of last year and into early 2022. There are signs that the pace of home price increases may be beginning to moderate, but the main input to the model has also been firmer than projected a year ago.
The combination of these two factors yields a considerably different set of results. The updated model now projects a much earlier peak, in May 2023, for shelter costs (Exhibit 1). That is the good news. In fact, by the end of 2023, the updated projections are slightly lower than the forecasts from a year ago—6.7% and 6.5%, respectively. The bad news is that the new peak is much higher than the peak forecasts from a year ago. The Dallas Fed model now has the year-over-year advances for rent and OER topping out at 8.4% and 7.7% respectively in May 2023.
Exhibit 1: Updated Projections of Rent and OER
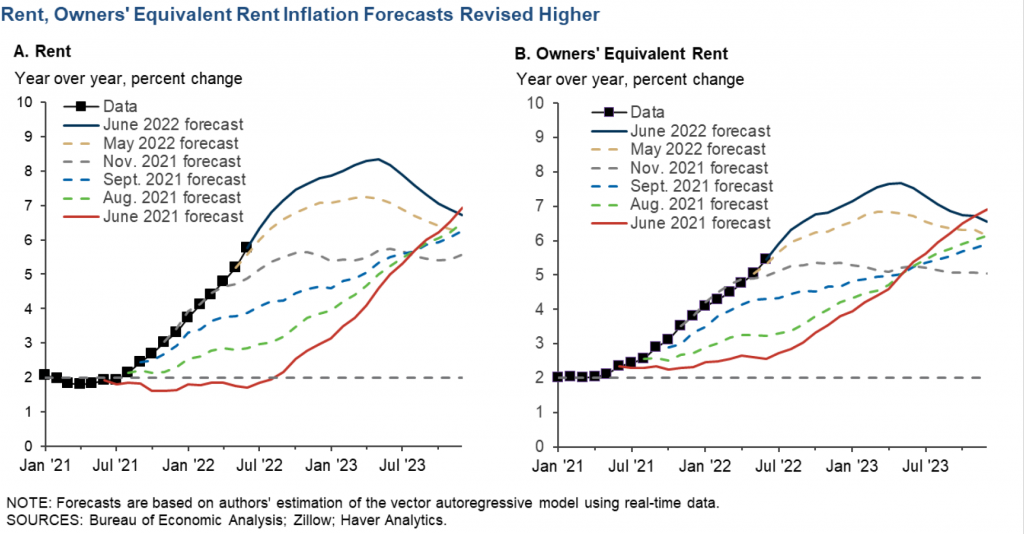
Source: Federal Reserve Bank of Dallas.
Implications for overall inflation
Shelter costs represent a massive percentage of the CPI, over 30% of the total and 40% of the core. The weights in the PCE deflators are markedly lower but still considerable, about 15% of the total and 17% of the core.
Given the weights, we can work out the projected contribution of the shelter costs components to aggregate inflation measures at different times. The contribution to core CPI inflation of rent and OER a year ago, now, and the projected contributions as of May 2023 and December 2023 tells an important story (Exhibit 2).
Exhibit 2: Contributions to Core CPI
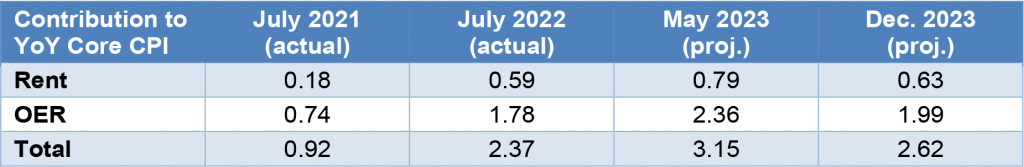
Source: BLS, Federal Reserve Bank of Dallas.
The acceleration in shelter costs added roughly 1.5 percentage points to the year-over-year core CPI inflation rate (2.37 minus 0.92) from July 2021 to July 2022. The core CPI over that period accelerated by about 2 percentage points, from 4.2% to 6.2%, so shelter costs accounted for about three quarters of the pickup.
For the core PCE deflator, the contribution is roughly half as large, so shelter costs only added an additional 0.6 to 0.7 percentage points to the year-over-year core inflation rate and accounted for about half of the acceleration in the core PCE inflation rate, from 3.6% to 4.9%.
Unfortunately, shelter costs are projected to continue to contribute to accelerating inflation going forward. As of May 2023, when the Dallas Fed model has shelter cost inflation peaking, the contribution to the core CPI will increase by another three-quarters of a percentage point to 3.15%. To put this into perspective, if every other category within the core rises at exactly the same pace over the 12 months ending May 2023 as in the most recent 12 months, then the pickup in shelter costs would push the year-over-year advance in the core CPI up from 6.2% to about 7%. Clearly, this would be sharply at odds with the relatively benign inflation outlook that is underpinning financial market expectations of easing in the second half of 2023.
Another way to think about the contribution to core inflation from shelter costs is that, if the Dallas Fed model proves correct, then in May 2023 the core CPI would run at 3.2% even if every other component outside of shelter costs was flat, a scenario that seems far too optimistic.
By December 2023, the model suggests that the contributions to core inflation would finally be declining. However, the December 2023 projections for rent and OER are still slightly higher than the current readings. If these model results prove accurate, it is hard to see how core inflation can decelerate as quickly and by as much as most economists and market participants currently expect. Fed officials have begun to suggest that once the policy rate peaks, it is likely to remain steady for a considerable period of time as the Fed waits for inflation to cool back to near the 2% target. The Dallas Fed model for shelter costs suggests that this wait could be quite extended, probably at least well into 2024.