


By the Numbers
A picture of ‘AAA’ secondary liquidity across CLO managers
Caroline Chen | August 26, 2022
This document is intended for institutional investors and is not subject to all of the independence and disclosure standards applicable to debt research reports prepared for retail investors.
CLO investors going into a new position in a manager’s debt almost always think about the possible ease and cost of exit. And if that time comes, the market typically uses a bid wanted in competition, or BWIC, to find the door. BWIC volume alone confirms the conventional wisdom that larger managers’ debt shows up in secondary more often than smaller managers’. But at least in 2022, BWIC volume on ‘AAA’ debt has broadly just reflected the outstanding amount of a manager’s debt. When it comes to the likelihood of trading off a BWIC list or the range of price talk dealers provide for a BWIC offer, the difference between large and small managers becomes insignificant. By these measures, liquidity across CLO managers may be spread more evenly than conventional wisdom thinks.
CLO investors have posted $20 billion of ‘AAA’ CLOs on BWIC lists so far this year, or 49% of the more than $40 billion in total CLO BWIC volume. The ‘AAA’ CLO market is a good place to start exploring CLO liquidity. Collectively, the bonds on those BWIC lists have their loan pools managed by 109 different managers. KopenTech captures the bonds on each BWIC, indicates whether each one traded and provides the high and low price talk from CLO dealers.
‘AAA’ CLO BWIC volume increases with managers’ CLO AUM
Larger CLO managers by definition have more bonds outstanding, and their bonds naturally tend to show up more frequently on BWICs. That is easy to see by comparing each manager’s share of current market AUM and share of YTD 2022 ‘AAA’ BWIC volume available from KopenTech (Exhibit 1). AUM and BWIC share rise together. For a 1% rise in AUM, BWIC share tends to rise by 1%, too. On average through 2022 so far, the market has tried to turn bonds into cash roughly in direct proportion to their outstanding amount.
Exhibit 1: As CLO manager AUM rises, so does its share of the secondary market
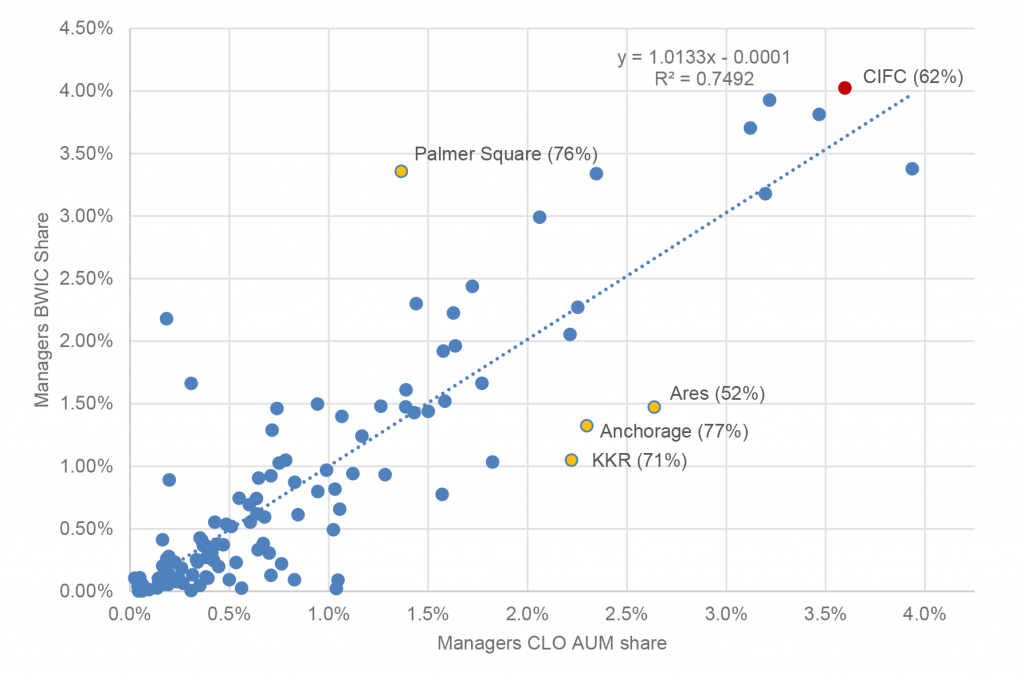
Note: Manager CLO AUM based on Amherst Pierpont calculation of outstanding par amounts of debt and equity as of July 2022. AUM share is each manager’s total divided by the total across managers. Manager BWIC share based on data from KopenTech from 1 Jan 2022 through 19 Aug 2022. BWIC share is the percentage of total par BWIC volume represented by par debt from each manager. Numbers in parentheses represent the percentage each managers debt on BWICs that actually traded. The dots represent 109 managers with an aggregate CLO AUM of $725.6 billion. $20 billion ‘AAA’ CLO BWIC volume is year-to-date through 8/19/2022.
Source: KopenTech, Amherst Pierpont Securities
There is plenty of dispersion in the numbers, of course. Some managers, such as Palmer Square, have seen their debt show up on BWICs much more frequently than AUM alone might predict. Palmer Square has roughly a 1.40% share of AUM but nearly a 3.40% share of BWIC volume. When Palmer Square debt has come to market this year on BWIC lists, 76% has ultimately traded. Other managers, such as KKR, have shown up on BWIC less frequently than AUM might predict. KKR has roughly 2.25% of AUM but only around 1.00% of BWIC volume. For KKR, 71% of BWIC offers have traded. Based on this 2022 snapshot alone, it is hard to draw strong conclusions about any particular manager. Over another period, some managers may show more trading that AUM would predict and some managers may show less. Time will tell.
These data do help explain why investors often view large managers as more liquid: volume. But volume is only one indication of liquidity, especially if volume comes only in proportion to outstanding amount. Other measures might be the proportion of BWIC offers that trade, and the tightness of broker price talk for BWIC offers. A high trade share and tight price talk presumably also signal better liquidity. Those measures paint a surprising picture of the market.
To go from BWIC to cash, size does not matter
When bonds come to market on a BWIC, only a certain percentage actually trade. Out of the $20 billion posted ‘AAA’ CLOs posted on BWIC so far this year, only $12 billion traded, a 60% traded share. At the manager level, the percentage of bonds offered on BWIC that actually trade, the traded share, has an insignificant correlation to managers’ CLO AUM (Exhibit 2). There is only a slight tendency for larger managers to show a higher traded share.
It is worth noting that the traded share for small managers is noisy. Small managers with a 100% traded share, for example, do not necessarily mean they have better liquidity. It could be a result of fewer trades on the BWIC lists. For example, Diameter Capital, a manager with $2.7 billion CLO AUM and 0.36% BWIC share, has a 100% traded share, but only two ‘AAA’ bonds with Diameter-managed collateral appeared on BWIC and exchanged hands in April and May.
The relationship between traded share and AUM becomes a little clearer by grouping some larger and smaller managers. In aggregate, the Top 10 managers with the largest BWIC share have their traded share ranging from the lowest at 39% to the highest at 76% with a median of 61%. By contrast, 73 managers, each having less than 1% BWIC share, have their traded share swing from 0% to 100% with a median of 56%.
Exhibit 2. A weaker relationship between managers’ AUM and ‘AAA’ traded share
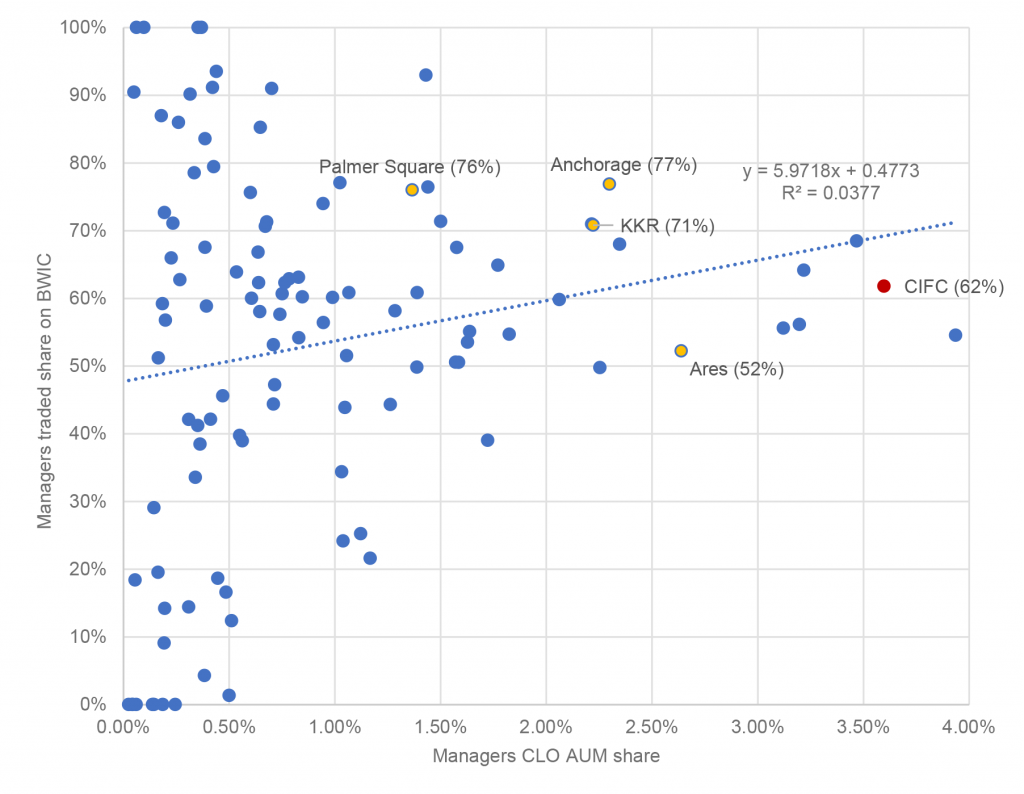
Note: A manager’s BWIC traded share is the percentage of traded BWIC to the total BWIC volume that is comprised of bonds from CLO deals they manage. Numbers in parentheses show the traded share of selective managers. The dots represent 109 managers with an aggregate CLO AUM of $725.6 billion. ‘AAA’ CLO traded BWIC volume is year-to-date through 8/19/2022.
Source: KopenTech, Amherst Pierpont Securities
The results from traded share argue that no matter how large or small a manager, once the manager’s debt shows up on a BWIC, the debt has roughly the same chance of turning into cash. By this metric, liquidity is fairly evenly distributed across managers.
Differences in dealer price talk vary little across managers’ BWIC share
In a liquid market, dealer price talk on bonds should fall in a narrow band. On average this year, the difference between the lowest and highest dealer price talk on a ‘AAA’ CLO BWIC offer has been around $0.8 every month (Exhibit 3). Looking at the manager level, there is no significant difference between price talk for bonds from large managers and price talk for bonds from small managers.
Measures of price talk difference again can be noisy. An indication of “98” could mean $98.00 or it could be a price with a $98 handle. And price indications do not necessarily mean a bond trades in the indicated range. A better analysis would look at price indications and actual traded prices, but trade prices are not widely available. Price talk from smaller managers that show up on BWICs less frequently could fall either above or below the typical range.
Grouping larger and smaller managers again helps sharpen the picture. Bonds from the Top 10 managers with the largest BWIC share have price talk differences ranging from $0.62 to $1.03 with a median of $0.70 on a monthly basis. Bonds from the 73 small managers have price talk differences ranging from $0.15 to $2.15 with a median of $0.65. In short, dealers’ price talk differences on the ‘AAA’ CLOs in the secondary market have been small regardless of the managers’ BWIC share. On this metric, liquidity also is fairly evenly distributed across managers.
Exhibit 3: Managers BWIC shares has little impact on price talk difference
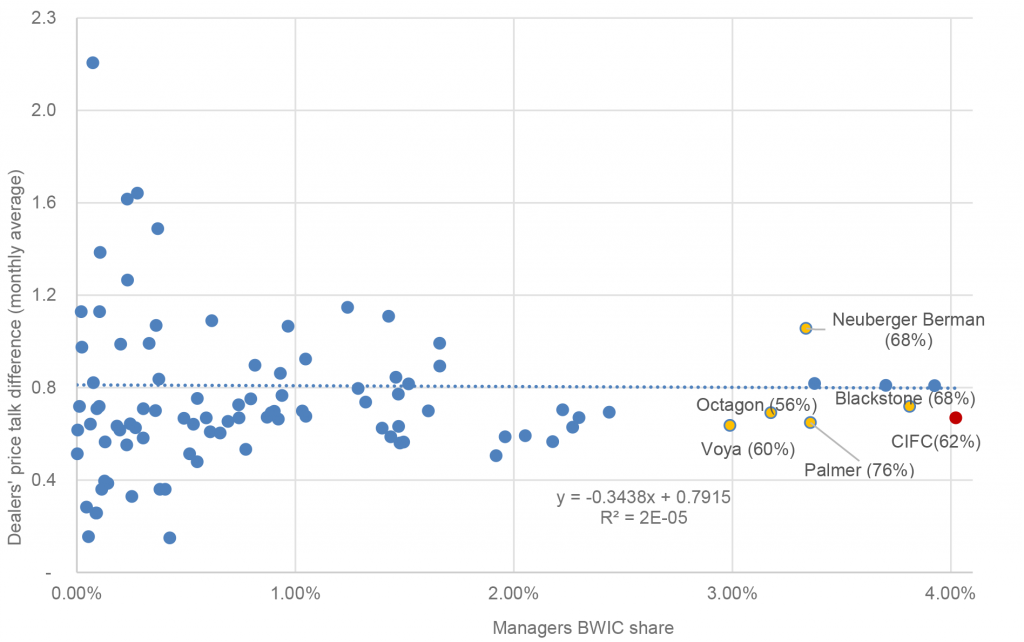
Note: Dealers’ price talk difference by managers calculates the average price talk difference for all traded AAA-rated bonds on the monthly BWIC that are from CLO deals they manage. A monthly average (Y-axis) represents the average of dealers’ price talks difference by managers from January to August. Numbers in parentheses show the traded share of selective managers. The dots represent 109 managers with an aggregate ‘AAA’ CLO BWIC volume of $20 billion year-to-date through 8/19/2022.
Source: KopenTech, Amherst Pierpont Securities
Caveats in order
BWIC volume clearly shows that larger managers’ debt comes to market much more frequently than smaller managers’, but it is simply in proportion to the amount of debt outstanding. When the debt does come to market, the chances of turning bonds into cash are roughly equal regardless of manager size. And the price talk on the BWIC offer is likely to show the same range regardless of manager size. On the later two measures, small and large managers are equally liquid.
These data do not say that a large and small manager, all else equal, get the same price for their debt. The perfect test of this possibility would be to present the market with two bonds identical in all respects except for the name of the platform. Of course, that does not happen in practice. That leaves open the possibility that the market prices small and large managers differently for a variety of reasons and, as a result, creates nearly identical chances of turning bonds into cash within the same narrow range of price talk.
These data also do not say the same pattern holds at all points in time. In another window of time or another type of market, the patterns between AUM, BWIC volume, traded share and price talk may change.
Finally, these data also do not say that large and small managers show the same pattern of volume, traded share and price talk at lower ratings. In other investment grade or speculative grade classes, the story may be different. That is an area for further work.
Despite the caveats, BWIC volume, traded share and price talk differences argue that CLO liquidity in 2022 is more evenly and subtly spread across managers than traded volume alone might indicate. This should be good news for CLO investors. Access to liquidity may be better than conventional wisdom thinks.