


The Big Idea
A bearish cyclical and bullish secular view of housing
Stephen Stanley | September 23, 2022
This document is intended for institutional investors and is not subject to all of the independence and disclosure standards applicable to debt research reports prepared for retail investors.
The housing market currently reflects a mix of unusually strong forces pushing in opposite directions. The market looks weak in the short run as housing affordability has plunged under a combination of soaring home prices and surging mortgage rates. Home sales have followed affordability lower and may remain soft for a while. But underneath the immediate weakness, secular forces continue to point to a housing market that is chronically undersupplied. After a period of adjustment, housing should find its footing far more easily than it did after the Global Financial Crisis, making a bullish case in the long run.
A cyclical role in today’s inflation
As the last few months have shown, housing is one of the most interest-sensitive parts of the economy and consequently one most subject to monetary policy. It is already clear that housing is bearing a disproportionate brunt of the tightening in monetary policy. But the effect of policy on housing goes beyond that market alone.
Housing is crucial in the overall inflation outlook. For most households, housing is their largest expense. That is reflected in the aggregate inflation indices. Shelter costs, rent and owners’ equivalent rent, constitute more than 30% of the overall CPI and 40% of the core component. The weightings are smaller for the Fed’s preferred PCE deflator, but shelter costs are still the largest single piece of that gauge as well.
It will be difficult for the Fed to get inflation under control unless or until shelter costs moderate. Recent research from economists at the Dallas Federal Reserve Bank has found that shelter costs correlate closely to home prices but with a significant lag. This makes sense, as most rental contracts tend to be at least a year, and not every household is signing a new rent contract in a given month. Intuitively, average shelter costs should lag home prices or measures of rental contracts by close to a year. And, in fact, the model developed by Dallas Fed researchers found that shelter costs tend to lag home prices by 12 to 18 months. They conclude that the inflation rates for rent and owners’ equivalent rent are unlikely to peak until mid-2023. This is a key reason that inflation should stay far higher than the Fed desires for much longer than most forecasters expect.
Housing, of course, affects more than just inflation, but it is a small piece of the economy. The residential construction is only 3.4% of real GDP. But housing does have massive ripple effects. When households purchase homes, they generally buy furniture, appliances, carpet and other things to fill up their new homes. It is not surprising that two of the weakest categories in retail sales over the past several months have been furniture stores and electronics and appliance outlets. The effects of slower housing are just starting to spread.
Similarly, housing represents a significant but small percentage of payroll employment. Overall construction accounts for 7.7 million jobs, about 5% of the total of payroll employment. Residential building represents about half of that. That part of the labor market will almost certainly loosen.
An affordability downshift
To understand the current downshift in housing, it helps to focus on the recent precipitous drop in affordability. Home prices have surged since the early days of the pandemic. On top of that, mortgage rates shot up in early 2022, with the 30-year mortgage rate nearly doubling from around 3% at the turn of the year to close to 6% in September. Simply plotting the combination of existing and new home sales against the National Association of Realtors affordability gauge tells the story of why home sales have weakened in the first half of the year and why further declines may be likely (Exhibit 1).
Exhibit 1: Home sales have fallen with affordability
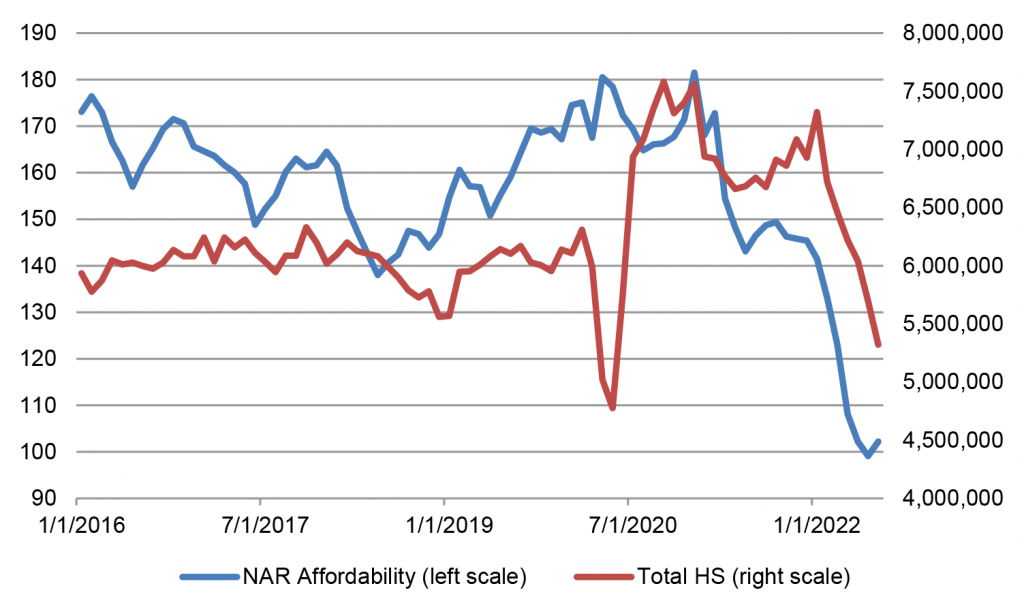
Note: The NAR affordability index is based on the median level of personal income weighed against the cost of financing a home purchase, which mainly reflects home prices and mortgage rates.
Source: NAR, Census Bureau.
Broadly, however, the affordability issue should self-correct over time. As housing demand has weakened, home price appreciation appears to have begun to moderate—more on that later. In addition, if the overall economy cools, mortgage rates should drop. While housing consequently is showing weakness at the moment and may continue to do so for a while, cycles, by their nature, come and go.
A secular shortfall in supply prevails in the long run
Over a longer horizon, the tone of the housing market depends, of course, on trends in supply and demand—trends that have shifted with pandemic. Those forces depend on trends in population growth, household formation, and the cost and availability of land, materials, and skilled construction labor. The housing industry boomed in the 1970s, for example, because members of the massive Baby Boomer generation reached the age when they began to buy homes. Housing starts exceeded 2 million regularly in the 1970s, a level never reached since, including during the 2000s housing boom with an even a larger overall population.
Broad trends in supply and demand shifted after the Global Financial Crisis. Prior to the pandemic, the housing market was generally considered tight, with firm prices and thin inventories. Homebuilders never fully reconstituted the capacity to build seen during the 2000s, as skilled labor moved to other industries during the lean years of the housing bust and buildable lots became increasingly difficult to find and more expensive in some parts of the country.
The market before pandemic could have been even tighter. For years, analysts projected that the large age cohorts representing the children of Baby Boomer parents—cohorts that had reached the traditional age of first-time home buyers—would move out of their apartments and into single-family homes. But this generation got married at a later age, had kids at a later age, and waited longer to seek larger accommodations. Another factor arguably delaying or preventing some households in this age group from buying their first homes was large student loan debt obligations. In any case, that demographic wave of home buying was finally starting to show itself just before Covid hit.
Pandemic has fundamentally altered the course of the housing sector. The combination of a desire to social distance and the massive shift toward an acceptance of remote work led to meaningful changes in housing demand.
Many families moved from urban apartments to larger homes in suburbs or even rural areas. From a unit perspective, that one-for-one trade need not affect the quantity of housing units needed, though it may generate an increase in the aggregate dollar value of housing construction since single-family homes are, as a rule, more expensive to build per unit than apartment buildings.
More importantly, more people sought their own place. Much of the doubling and tripling up that had been increasingly common in the 2010’s, whether it be multiple generations of families living together—including the iconic young adult living in his or her parents’ basement—or a group of young friends cramming five or six people into a 3-bedroom apartment, suddenly lost its appeal.
The result was a surge in household formation well beyond housing starts. Supply already lagged demand before pandemic, seen in household formation generally growing faster in the late 2010s than housing starts (Exhibit 2). It should be the other way around, as some percentage of housing starts are replacements for units that were demolished or destroyed by fire or natural disaster. Traditionally, 200,000 to 300,000 units are permanently lost each year. Housing starts, in theory, should exceed household formation by about that amount.
Exhibit 2: Annual household formation has outstripped housing starts
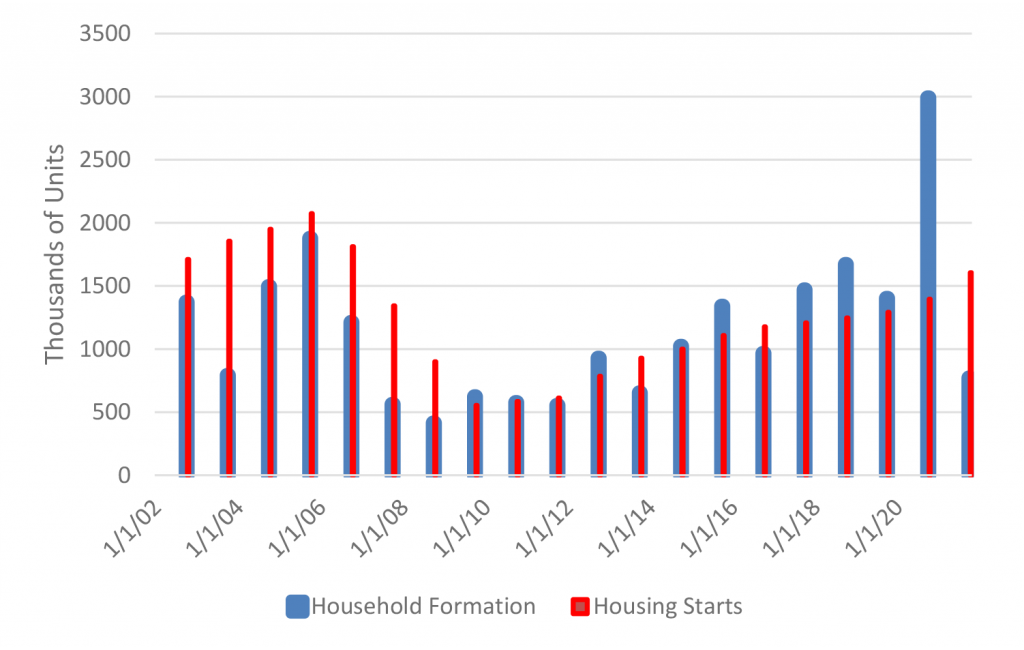
Source: Census Bureau.
The imbalance between household formation and housing starts leads to a rough estimate of the scale of the housing supply shortfall. Assuming housing starts should exceed household formation by about 250,000 a year and assuming the housing market was in rough supply-and-demand balance in 2001, the cumulative increases in the two series suggest that the supply of housing at the end of 2019 was short of demand by over 1 million units.
In any case, the pandemic threw the housing market far out of balance. Household formation, which had averaged between 1.3 million and 1.4 million per year over the prior five years, spiked to 3 million in 2020. That means that the demand for housing units surged by an extra 1.7 million or so above and beyond the normal rate of growth in a single year. Builders were constrained during the pandemic. Housing starts did increase, even in 2020, but it will take builders years to catch up to the massive shift in demand for homes that took place in 2020.
It is worth looking at the latest figures and considering how much of the supply-demand gap created by the pandemic has been filled. There are two dynamics here that will help to close the imbalance. First, not all of the spike in household formation during 2020 will prove permanent. For example, some households may have procured second homes in remote locations during the worst days of the pandemic with the intent to revert back to their pre-Covid homes when the dust settled. In contrast, some of the shifts seen in 2020 will prove persistent. Then, of course, on the supply side, builders can be expected to step in over time and build more homes.
On the demand side, household formation did in fact moderate in 2021 to around 800,000, well below the pre-pandemic norm. The data for the first half of 2022 would equate to about a 1.1 million annual pace. If we assume the pre-Covid benchmark was 1.3 million a year, then, of the 1.7 million excess in 2020, close to 700,000 has been reversed over the subsequent year and a half. That still leaves demand about 1 million units ahead of where it might have been if the pandemic had not occurred. Presumably, that figure may come down somewhat further over the next few years.
On the supply side, housing starts did step up in 2020 and 2021. The annual pace in 2020 of 1.4 million, even with the public safety restrictions imposed on activity in the spring of that year, was modestly higher than in previous years. Then, last year, housing starts surged to 1.6 million, the highest annual tally since 2006.
In sum, the housing market may have been undersupplied by around 1.3 million units just before the pandemic, roughly a year’s worth of housing starts. At the end of 2020, that imbalance spiked to around 3 million units. By the end of last year, the imbalance had narrowed to about 2.5 million, and it remained near there as of mid-2022. Elsewhere in this special issue, Laurie Goodman points to thoughtful sources that put the shortfall at the end of 2021 much higher, varying from 3.8 million to as much as 5.5 million. But almost all approaches point to a chronic shortfall in housing supply.
In any case, if the underlying pace of household formation is 1.3 million to 1.4 million, then, in light of the loss rate of housing units, housing starts would need to run in the 1.6 million range simply to keep up. This should maintain a decent floor under housing activity going forward.
The extreme pressure in the housing market seen up until a few months ago—as evidenced by surging home prices, rock-bottom inventories, and bidding wars—represented in part a cyclical response, as household balance sheets have been flush and mortgage rates were historically low. However, the bulk of the impetus was likely a result of a persistent rise in demand for housing, independent of the business cycle.
In a few years’ time, the cyclical dust should clear, with affordability finding its way back toward a normal level. The historical average for the NAR gauge is about 125, in between the elevated levels seen prior to the pandemic and the current depressed levels. In addition, over that period, the longer-run supply-and-demand picture should settle down as pandemic shifts partially reverse. Once we reach that point, it seems likely that the housing market will still be undersupplied, as it was before the pandemic, which argues for solid levels of building activity and a tailwind to the trend for home price appreciation. This is a bullish secular case for housing.
A case for a year or so of flat home price appreciation
The severe supply-and-demand imbalance in the housing market helped drive extraordinary home price appreciation in 2020 and 2021. As the housing market cools on a cyclical basis, home prices appear to be moderating, either leveling off or falling, depending on the particular local market and source of information. That raises the issue of the course of home prices in the short and long run.
At least at a national level, home price appreciation and nominal GDP growth should track together over time. Elsewhere in this special issue, Brian Landy looks at local influences on home price appreciation and the wide dispersion expected over the next few years. But one reasonable approach to a national estimate of future appreciation starts by comparing the FHFA Home Price Index with the level of nominal GDP (Exhibit 3). Assuming again that the housing market was roughly in balance at the beginning of the century and housing prices were at the “right” level compared to nominal GDP. Home prices moved well into expensive territory during the housing boom of the 2000s, then overshot during and after the Global Financial Crisis.
Exhibit 3: Home prices track nominal GDP in the long run
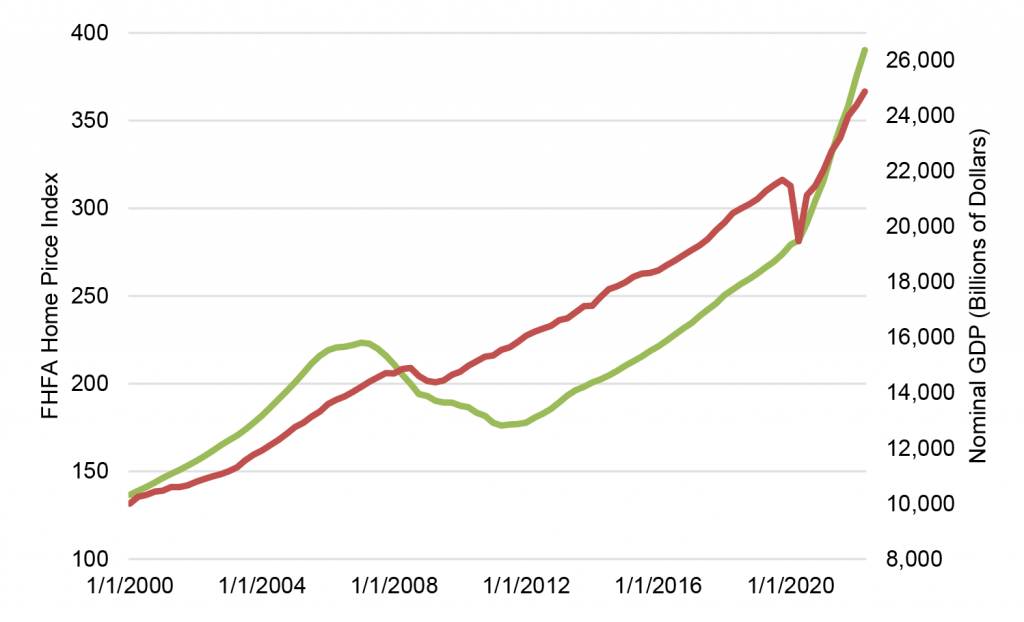
Source: FHFA, BEA.
There would appear to be little question that home prices were expensive in late 2021 and early 2022, just before the cyclical slowing in the housing market. By how much is hard to say. Plotting home prices against nominal GDP suggests prices may have been too high by about 10%. This seems like a big gap, but keep in mind that the steep pace of overall price inflation changes the way to think about home price appreciation. A 10% appreciation in home prices is a different proposition when overall inflation is 6% or 8% than it is when inflation is 2%.
In any case, if home prices are roughly 10% expensive relative to their long-term relationship with nominal GDP, then a year of flat home prices coupled with a 10% rise in nominal GDP would bring the two back into balance. My projections for nominal GDP growth in 2022 and 2023 are 9.4% and 7.5%, respectively, so that scenario is not as outlandish as it may have sounded in a lower inflation environment. Still, it is worth noting that when home prices are surging or weak, they tend to overshoot their “fair value,” so an underperformance relative to nominal GDP growth larger than 10% is quite possible.
Homeowners’ equity should cushion households
One of the factors that led to such broad damage to the economy in the late 2000s, when the housing market busted, was that homeowners ratcheted up their leverage. As a result, when home prices fell, a substantial proportion of homeowners found themselves with negative equity and walked away, creating a massive problem for banks and holders of mortgage-backed securities.
That sort of dynamic is unlikely to be repeated in the near future, even if home prices drop by much more than I anticipate. The percentage of residential real estate asset value that represents homeowners’ equity—the rest constitutes mortgage debt—eclipsed 70% this year for the first time since 1986 (Exhibit 4). And the reading of 70.5% in the second quarter this year matched the highest reading since 1983 and was within a few tenths of the highest level since 1960. Keep in mind that in 1983, 30-year mortgage rates were 13%, so it makes sense that homeowners were trying to minimize their debt back then.
Exhibit 4: Homeowners’ equity as a percentage of real estate value
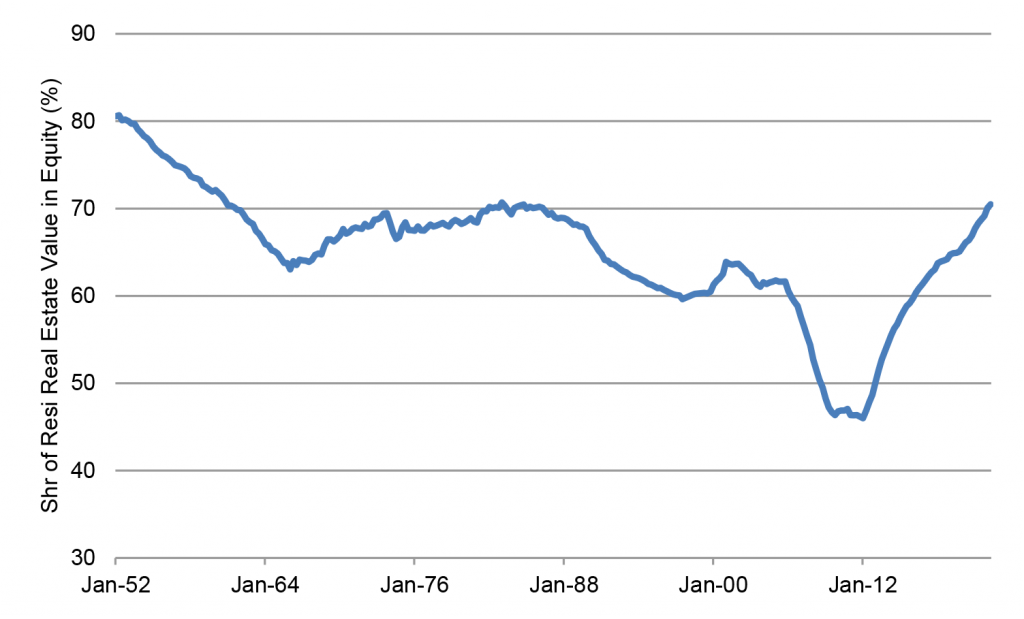
Source: Federal Reserve.
In any case, most homeowners, aside from the most recent buyers, should have plenty of positive equity in their homes in all but the worst-case scenarios for home prices. This should alleviate any concerns about a 2000s-style housing-driven financial meltdown.