


The Long and Short
Choosing between credit or duration risk
Dan Bruzzo, CFA | October 21, 2022
This document is intended for institutional investors and is not subject to all of the independence and disclosure standards applicable to debt research reports prepared for retail investors.
The corporate primary market has proved highly inconsistent over the past month and a half, with prospective issuers struggling to navigate day-to-day swings in risk market sentiment. This has limited new supply and forced issuers to postpone or indefinitely delay new bond deals. With less consistent options available through the primary calendar, investors should consider strategies in the secondary market to achieve incremental yield—specifically, weighing the alternatives of adding credit or duration risk.
The dynamics of the corporate bond market have changed considerably over the past several months, the aftermath of historic move in rates and the inverted yield curve, Investment grade corporate bond spreads hit a new local wide on October 12 as the Bloomberg Barclays Investment Grade (IG) Index closed at 165 bp option-adjusted spread (OAS) – the highest level since June 2020 during the height of the pandemic. Higher Treasury rates and wider spreads have pushed up the investment grade corporate yield curve (Exhibit 1).
Exhibit 1. US Treasury and investment grade yield curve
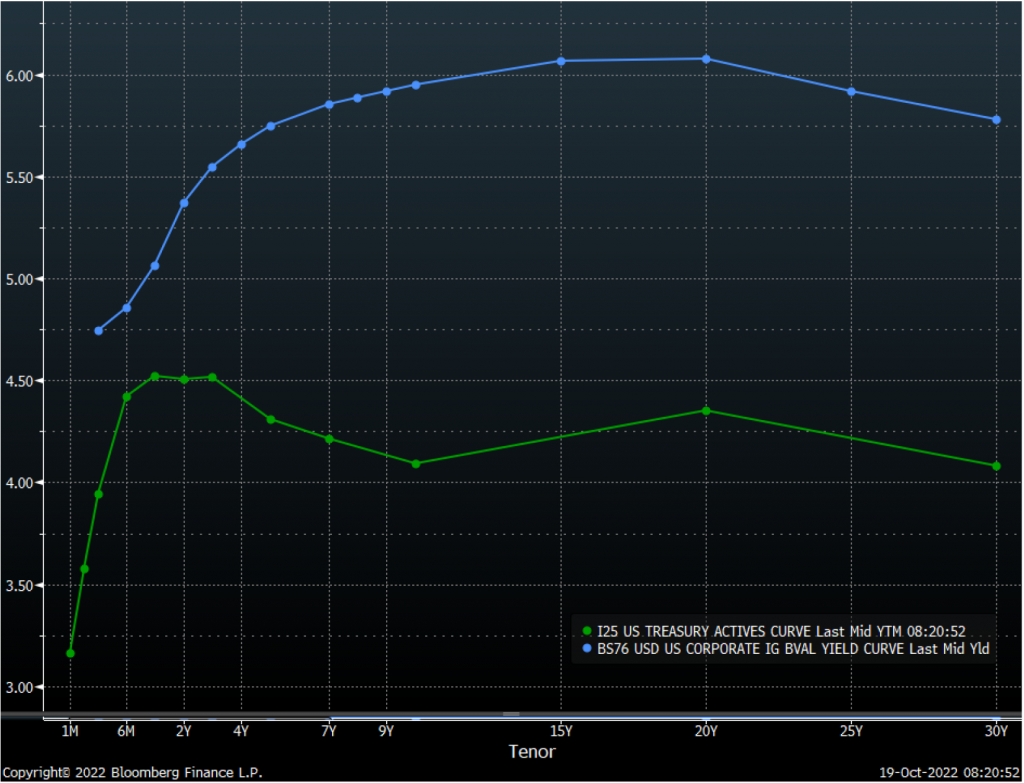
Source: Amherst Pierpont, Bloomberg
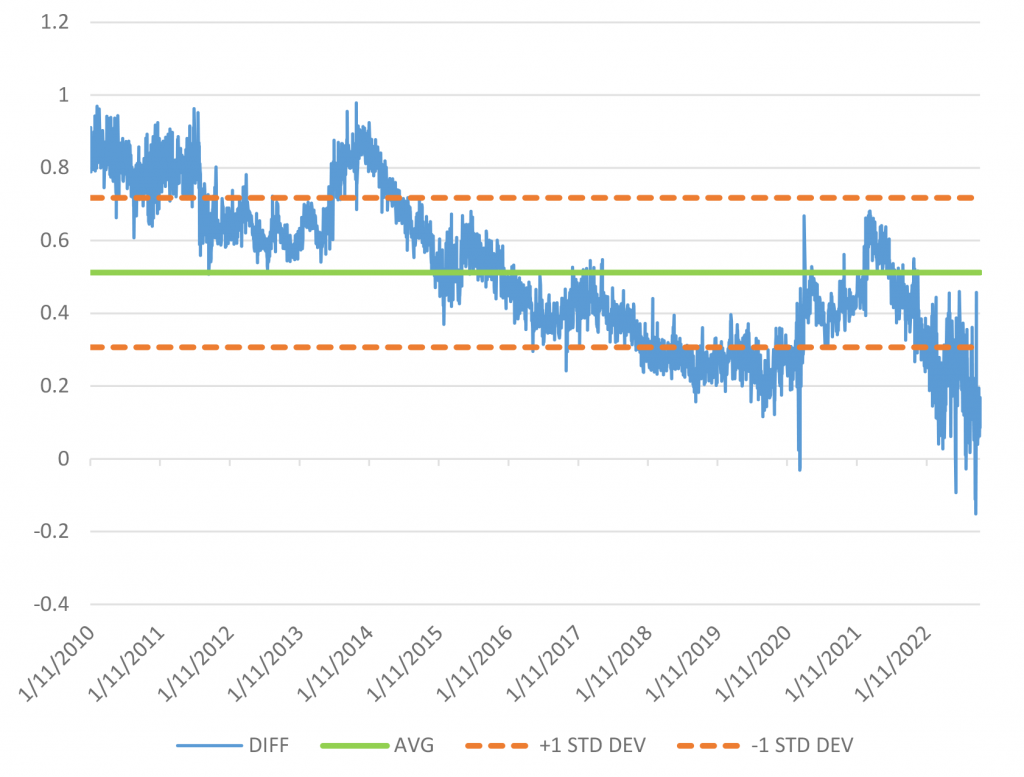
Trading from ‘A’ credit to ‘BBB’ credit looks like fair value for now. Investors currently earn an additional 55 bp of approximate spread to move down in credit to ‘BBB’ from ‘A’ (Exhibit 2). On an historic basis, the average spread pick is 59 bp with a standard deviation of 16 bp. So currently investors are earning just under the average to take on this additional credit risk. This path to incremental spread compares favorably to the extension trades illustrated below, but not as historically attractive as the current compensation to move from ‘AA’ credit to ‘A’ credit.
Exhibit 2. ‘A’ OAS compared to ‘BBB’ OAS
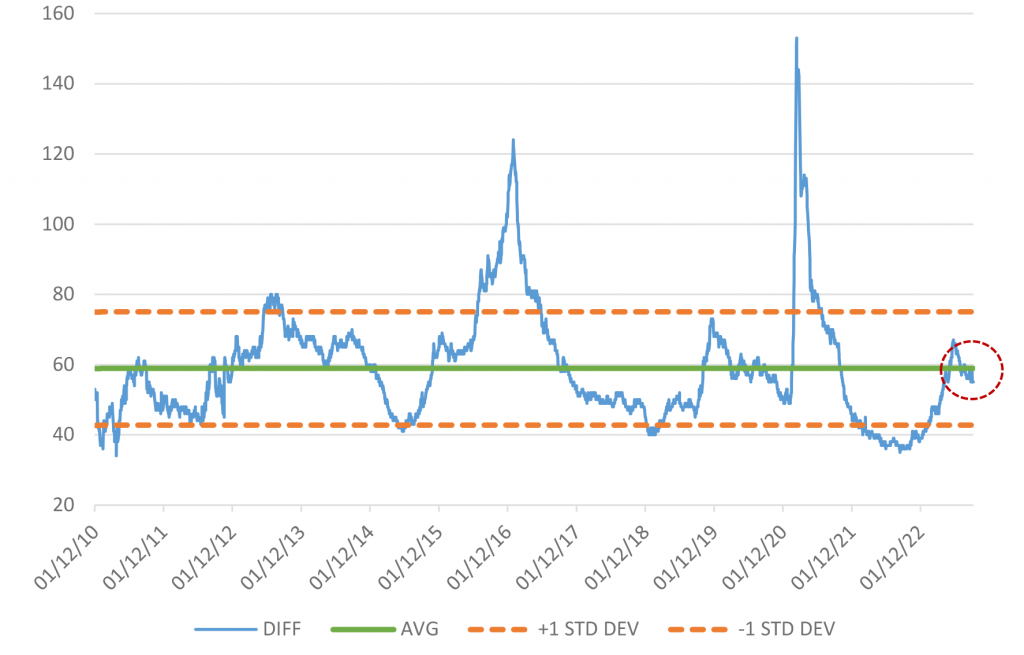
Source: Amherst Pierpont, Bloomberg, corporate indices OAS
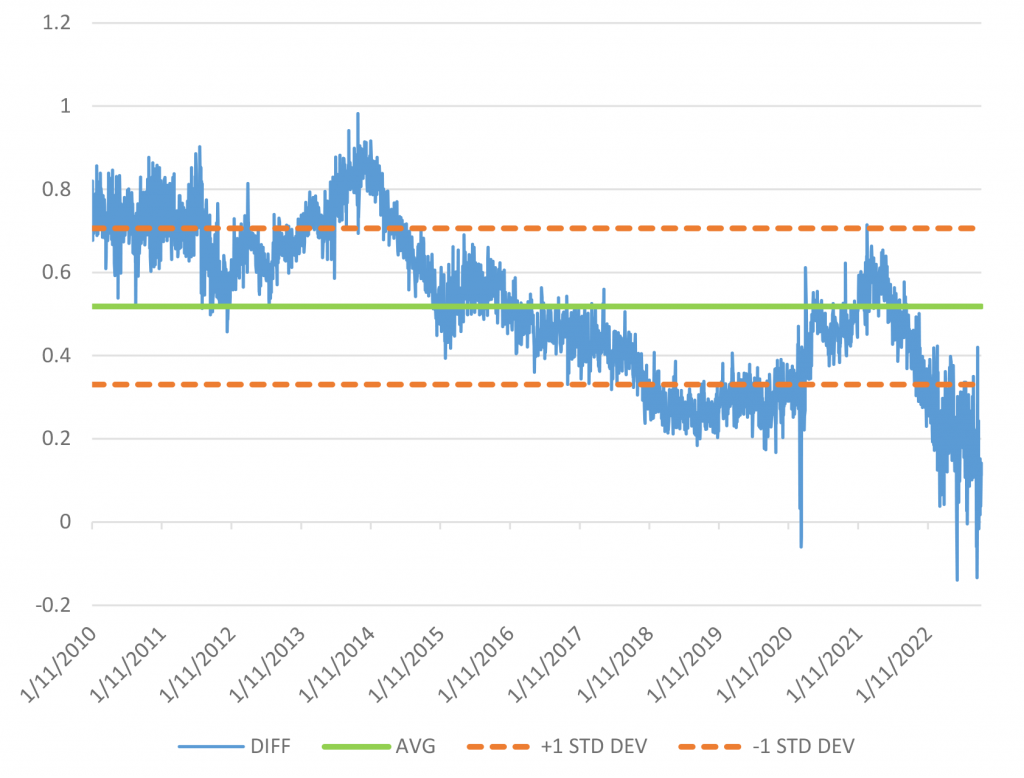
Moving from ‘AA’ to ‘A’ looks like better value. Investors can currently earn an additional 54 bp of spread to move down in credit to ‘A’ from ‘AA’ (Exhibit 3). That level compares with an average spread pick of 32 bp, which is registering well above a full standard deviation of 11 bp. In fact, this is the highest level of additional risk compensation since the height of the global pandemic, and one of the highest levels relative to mean over the entire 12-year time horizon. This appears the most attractive option for investors to achieve incremental yield relative to historical relationships in the studies presented here.
Exhibit 3. ‘AA’ OAS compared to ‘A’ OAS
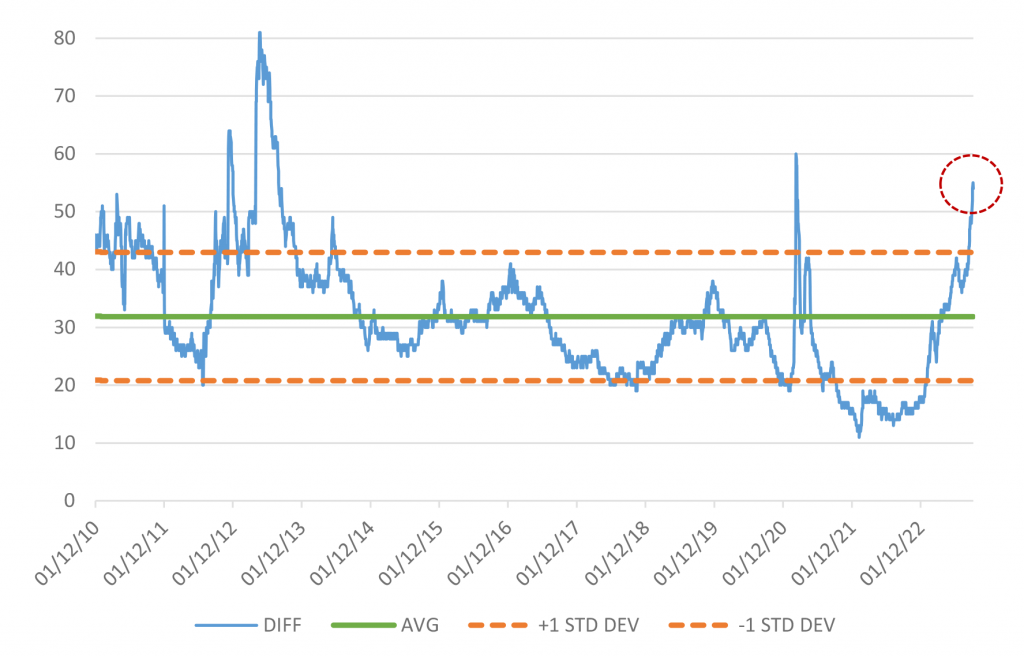
Source: Amherst Pierpont, Bloomberg, corporate indices OAS
Some examples of actionable AA to A trade suggestions:
- Underweight: CME 2.65% 3/15/32 @ 128/10Y (CME Group: Aa3/AA-/AA-)
- Overweight: CBOE 3% 3/16/32 @ 157/10Y (CBOE Global Markets: A3/A-)
- Pick up: 29 bp
- Underweight: V 2% 8/15/50 @ 90/30Y (Visa: Aa3/AA-)
- Overweight: PYPL 5.05% 6/01/52 @ 192/30Y (PayPal Holdings: A3/A-/A-)
- Pick up: 102 bp (note: significant coupon differential/discount dollar price)
- Underweight: ADP 1.25% 9/01/30 @ 87/10Y (Auto Data Process: Aa3/AA-/AA-)
- Overweight: SPGI 1.25% 08/15/30 @ 131/10Y (S&P Global: A3/A-)
- Pick up: 44 bp
Meredith Contente provides additional ‘AA’-to-‘A’ ideas elsewhere in this issue.
Investors can also extend credit portfolio duration along different parts of the yield curve:
- 3-year to 5-year
- 5-year to 7-year
- 7-year to 10-year
The flat intermediate yield curve for investment grade corporates is highly evident in the historical data and the current yield ladder from 3s to 10s. The first of these options currently presents the opportunity to add just 20 bp of yield for a move from 3-year maturity to 5-year maturity. That compares with a 12-year average of 60 bp, and is well below a full standard deviation of the mean, which is 27 bp. Similarly, an extension trade from 5-year maturity to 7-year maturity offers up just under 11 bp of incremental yield. That compares with a 12-year average of 51 bp and is below two full standard deviations from the mean. An extension trade to 10-year maturities from 7-year is likewise discouraging with a yield differential of under 10 bp versus a 12-year average of 52 bp and a standard deviation of 18 bp. So, among the three options presented here, the 3-to-5-year trade offers up the better yield grab historically versus the other two; but as demonstrated earlier, investors are better suited to seek yield through down-in-credit strategies versus taking on additional duration risk.
Exhibit 4. Incremental yield for moving to 5-year corporate from 3-year corporate
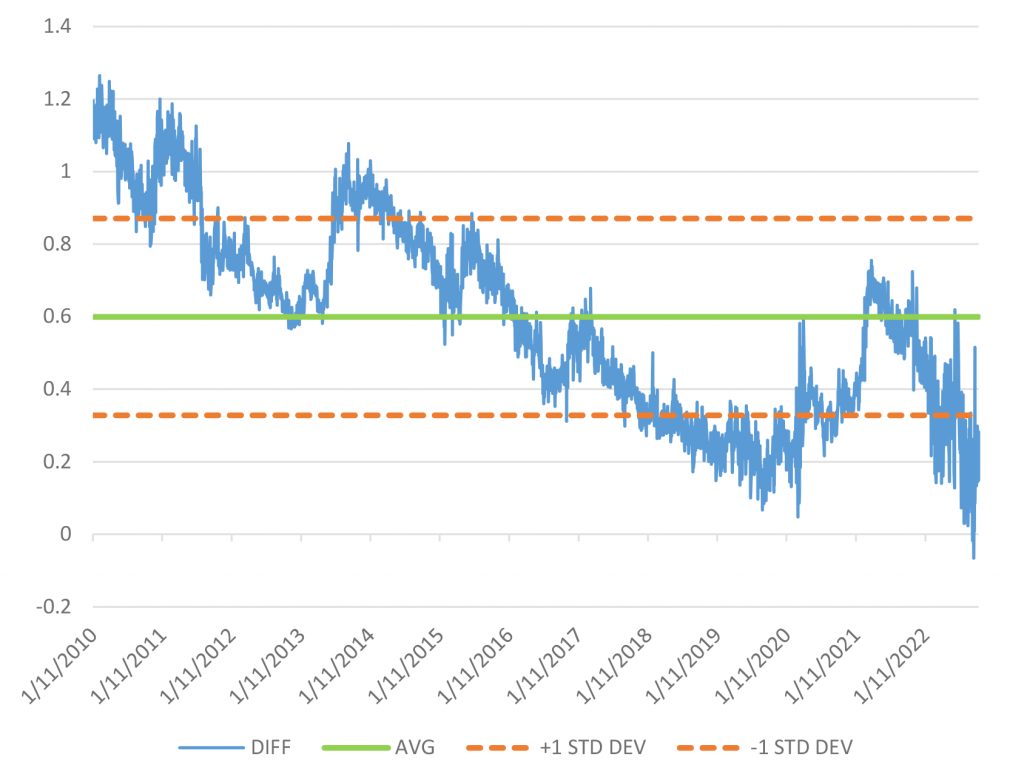
Source: Amherst Pierpont, Bloomberg
Exhibit 5. Incremental yield for moving to a 7-year corporate from a 5-year corporate
Source: Amherst Pierpont, Bloomberg
Exhibit 6. Incremental yield for moving to a 10-year corporate from a 7-year corporate.
Source: Amherst Pierpont, Bloomberg