


By the Numbers
Out-of-consensus calls on the 2023 CLO market
Caroline Chen | November 18, 2022
This document is intended for institutional investors and is not subject to all of the independence and disclosure standards applicable to debt research reports prepared for retail investors.
The CLO market has some big challenges ahead of it next year. A rising cost of funds and slowing growth is a hard combination to manage on highly leveraged balance sheets. And downgrades in ‘B-‘ loans, which now make up 30% of the average CLO portfolio, could push up deal exposure to ‘CCC’ loans and put important collateral performance tests at risk. And then there’s the final leg of the LIBOR-to-SOFR transition, scheduled to close by the end of June 2023. There may be refuge in better managers. There may be refuge in static CLO deals. There may be refuge at the top of the capital stack.
All of this leads to three calls outside the consensus on the 2023 CLO market:
- CLO ‘CCC’ exposure should approach or exceed May 2020 levels
- New static CLOs should offer some of the best relative value
- The LIBOR-to-SOFR transition should still hit some bumps
CLO ‘CCC’ exposure should approach or exceed May 2020 levels
Many CLO investors argue that their managers should be able to trade their way through the stresses of the year ahead. But CLOs look vulnerable to a wave of downgrade in ‘B-‘ leveraged loans that few CLOs look likely to escape.
With a drop of 1-notch, ‘B-‘ turns into ‘CCC’. And ‘CCC’ exposure, usually combined with loans purchased below $80 and any loans in default, can lead a deal to fail a standard overcollateralization or OC test. A failed OC test triggers diversion of cash flow away from equity and junior debt to pay down senior classes. Spreads on the junior debt usually widen, and the senior debt as well.
Shortly after the start of pandemic in 2020, for example, downgrades tripled the amount of ‘CCC’ credits in BSL CLOs from 4.0% at the end of February to 12.3% in May. The average junior tranche OC test cushion—the share of loan par left before a deal fails the test on the lowest rated class—dropped to a low in June of 1.13%. As a result, S&P lowered ratings of 471 BSL CLO tranches out of the 3,786 rated in the second half of 2020. Most downgrades came in bonds initially rated ‘BB’ or below.
The share of ‘B-‘ loans in BSL CLOs today is near a record 30%, arguably making the risk of a wave of ‘CCC’ credits higher than ever. As for the impact on CLOs:
- The average BSL CLO already has ‘CCC’ exposure of 4.02% (Exhibit 1)
- Most deals have a limit of 7.5% exposure to ‘CCC’ before the loans start to count against the junior OC test
- That only leaves room to absorb another 3.48% in ‘CCC’ before the penalty clock starts ticking
- So downgrades in only 11.6% of the ‘B-‘ loans in CLOs—11.6% x 30% = 3.48%—would start to penalize the CLOs’ for ‘CCC’ exposure, and that is a thin margin
Exhibit 1: The average CLO has a thin margin for absorbing more ‘CCC’
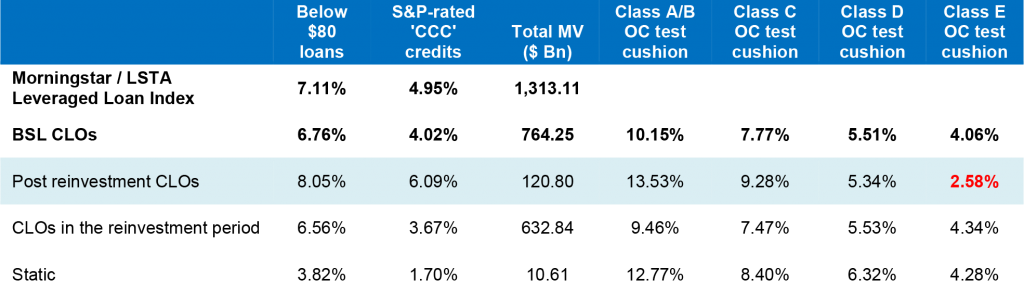
Notes: Leveraged loan index market value data as of October 2022. CLO market value is based on the Markit price as of November 10, 2022. Exposure to below $80 loans and ‘CCC’ credits are weighted by the market value of the collateral balance. The test cushions are also weighted by the market value of the collateral balance.
Source: LCD Pitchbook, Intex, Amherst Pierpont Securities LLC.
Downgrades in ‘B-“ loans in past recessions have far exceeded 11.6%. According to an S&P rating transition study, the percentage of downgrades in a static pool of ‘B-‘ issuers during 2009 was 44%, and in 2020, 34%. The median 1-year downgrade rate in ‘B-‘ loans from 2001 to 2021 was 18%. Applying those historical rating transitions to current ‘B-‘ loan exposure in CLOs, the vast majority of CLOs will see a jump in ‘CCC’ credits and exceed the maximum allowed 7.5% exposure next year. At the 18% median 1-year downgrade rate for ‘B-‘ loans, median exposure for CLOs over their ‘CCC’ limit should approach the levels of May 2020 (Exhibit 2). And a rate of downgrade similar to earlier recession would exceed May 2020.
Exhibit 2: ‘CCC’ loans in BSL CLOs may be higher than during the pandemic

Notes: ‘B-‘ issuer downgrades data are from S&P Global Ratings CreditPro, The data reflect a static portfolio and one-year rating transitions. Excludes financial and insurance services. The CLO analysis includes 1709 BSL CLO with an outstanding collateral balance of $809 Bn. The 7.5% CCC exposure is based on S&P ratings. To calculate the potential new ‘CCC’ share, the S&P rating transitions are applied to current ‘B-‘ loan exposure in CLOs along with the existing ‘CCC’ exposure. The ‘B-‘ rating is a predominant rating in Intex that is assumed in the majority of the CLOs for that loan by the respective industry. The exposure to ‘CCC’ is based on the current collateral balance. Data as of October 2022.
Source: S&P, Intex, Amherst Pierpont Securities
Exceeding 7.5% ‘CCC’ exposure does not mean a deal fails an OC test—that depends on the prices of excess ‘CCC’ and discount loans and on defaulted loan recovery rates—but it does expose the deal to regular measurement against the test. Of course, that adds risk.
Even though recession may not necessarily come next year, it seems highly likely by 2024. That should keep spreads on ‘BB’ and ‘B’ tranches trading wide.
Structural protections insulate the top of the capital stack from downgrade risk, but the spread of senior bonds in the same trusts may also leak wider due to deteriorating collateral. This should drive a trade where managers able to avoid OC test failures trade far better in every tranche than managers just surfing a ‘CCC’ wave.
New static CLOs should offer some of the best relative value
Static CLOs look likely to offer some of the best relative value next year. The average CLO loan portfolio delivers returns that roughly match the Morningstar/LSTA loan index with roughly the same risk. So finding managers that routinely outperform the market can be difficult. Although manager’s have little influence on static CLOs, the structure offers transparency on portfolio risk over the life of the deal. And bonds in static CLOs should build up credit enhancement after the deal closes as classes amortize. Price tiering in the new issue static CLO market may also provide some opportunities next year (Exhibit 3).
Exhibit 3: Tiering in static CLO primary market may linger in 2023

Data as of October 2022.
Source: Bloomberg, Amherst Pierpont Securities LLC
Static CLOs traditionally have represented a small share of the primary market in the past years, but their issuance has been on the rise. The $8.8 billion in new issuance year-to-date marked the highest volume in the past five years and involved more CLO managers, including some first-time issuers (Exhibit 4). High CLO funding cost has made traditional arbitrage much more challenging this year, and some managers have found a solution in static CLOs. The share of static CLOs may continue to climb in 2023 as funding costs look unlikely to ease with rising credit concerns and an overhang of aged warehouses. More managers may tap the primary market with static CLOs next year.
Exhibit 4. The rise of static CLOs amid high CLO funding cost ($Million)
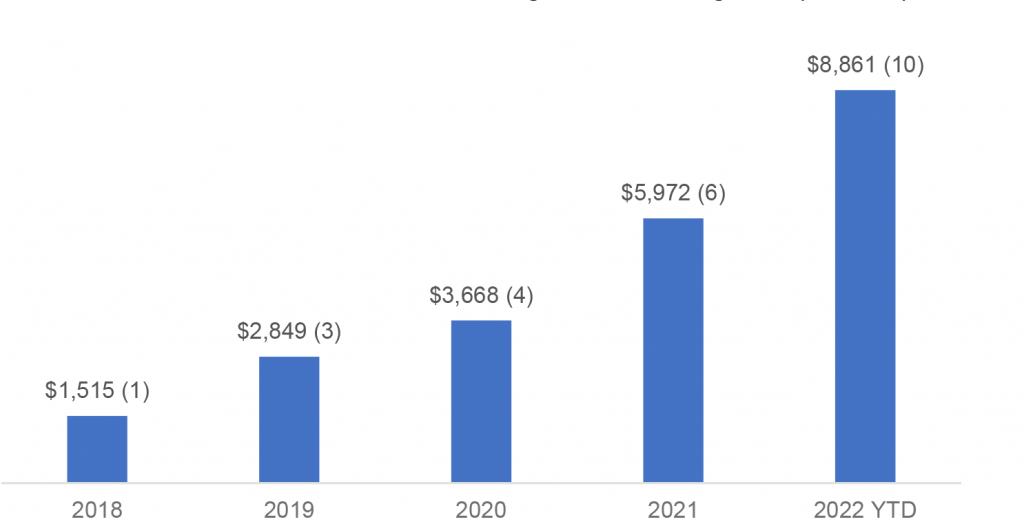
Notes: the number in the bracket reflect the number of managers who issued static CLO in a year. YTD data as of October 2022.
Source: LCD Pitchbook, Amherst Pierpont Securities LLC
Some bumps in the LIBOR-to-SOFR transition
It is known that LIBOR and SOFR transition will happen in 2023, but it is uncertain how many loans in CLOs will transit to SOFR without a credit spread adjustment. Depending on the language in loan documentation, investors may lose the credit spread adjustment if loan documentation does not contain an explicit hard-wired LIBOR transition language. A recent Covanta debt amendment is a good example. According to Creditflux, the $1.35 billion term loan B from Covanta, a waste management company, may sit in $686 million US CLOs. The loan documentation does not feature a hard-wired transition language, and if the loan amendments would be executed, its lenders would lose the credit spread adjustment between 3-month LIBOR and SOFR. If many loans in CLOs would transit in 2023 without a credit spread adjustment, it would impact the excess spread in CLOs.
S&P did a rating impact analysis in June. In a conservative scenario assuming no CSA adjustment on all loans but a 26 bp adjustment to the CLO liabilities, all senior bond ratings remained intact under a 25 bp reduction in excess spread. While 10% of ‘BBB’ rated bonds and 30% of ‘BB’ rated bonds may have a rating impact under the scenario, the agency did not anticipate material CLO rating movements back then. It is worth monitoring if the agency view will change when a wave of loan downgrades erodes the junior bond OC test cushions.