


Uncategorized
Rising risks from BBBs
admin | August 24, 2018
This document is intended for institutional investors and is not subject to all of the independence and disclosure standards applicable to debt research reports prepared for retail investors.
US fixed income may be more leveraged to the path of the economy than it has been in at least a decade. Growth in ‘BBB’ corporate debt, now at $3 trillion, has created a new set of risks should the US economy soften in the next few years or slip into recession. Wider debt spreads and potential loss of access to prime funding markets would likely hurt ‘BBB’ issuers, pressure the broad set of portfolios now holding the paper and widen spreads on other fixed income assets. Corporate leverage has replaced household leverage as the new source of risk and opportunity.
Fired up by low rates and M&A
‘BBB’ corporate debt now constitutes 51% of all outstanding investment grade issues, up from 31% a decade ago (Exhibit 1). Since overall corporate debt has grown so quickly since 2008, the absolute amount of ‘BBB’ debt has more than doubled. Most insurance portfolios, mutual funds, pensions and other portfolios benchmarked against broad fixed income indices have exposure.
Exhibit 1: ‘BBB’ issuers now dominate outstanding rated corporate debt
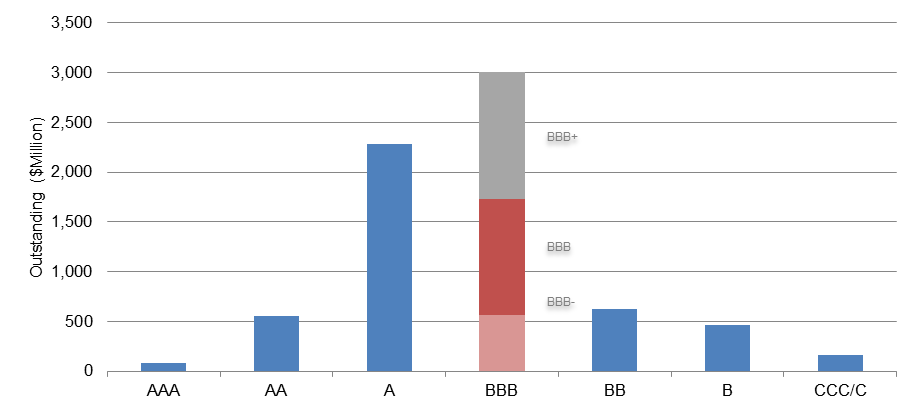
Chart shows the face value of U.S. corporate bonds rated by S&P Global Ratings. Includes bonds from financial and nonfinancial corporates. Data as of June 30, 2018. Source: S&P Global Fixed Income Research.
Low absolute interest rates and relatively tight spreads over the last decade have fed the surge. A ‘BBB’ issuer today pays a lower rate than a ‘AA’ issuer did in 2007. Low funding costs have allowed issuers to increase overall balance sheet leverage without significantly increasing the cost of debt service (Exhibit 2). The benefits to corporate shareholders are clear: a rising return on equity. Higher leverage at attractive cost has led a Who’s Who of issuers to drift down to ‘BBB’ including Abbott Labs, AT&T, McDonalds, Verizon and Walgreens – all ‘A’ or better a decade ago.
Exhibit 2: Low rates have allowed rising leverage without rising cost
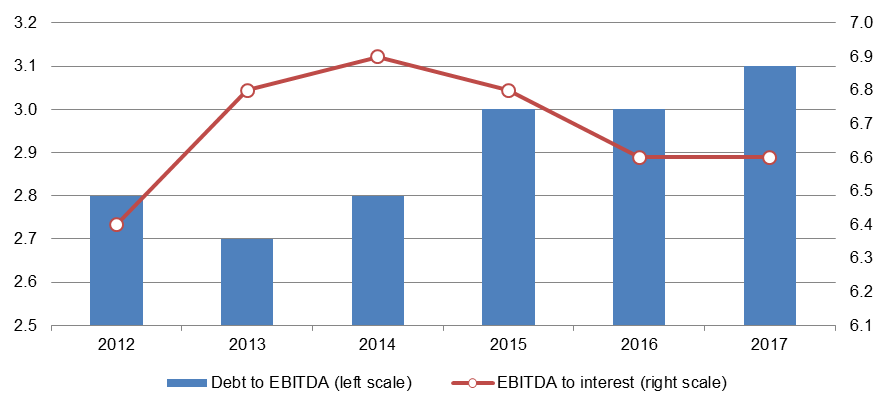
Includes investment-grade nonfinancial corporates (including the real estate and utility sectors) with publicly available financials. Chart shows median ratios. Sources: S&P Global Market Intelligence and S&P Global Fixed Income Research.
Mergers and acquisitions have also fed the charge, especially in 2018. Although the number of M&A transactions this year roughly matches the same period last year, dollar value has jumped 65%. Most acquirers continue to finance transactions primarily with debt. Issuers unable to grow revenue through broader distribution, wider margins or new products have grown instead by acquiring companies and trying to wring out overlapping costs. This is been especially true in consumer packaged goods, which has seen mergers between iconic brands such as Kraft and Heinz, Campbell Soup and Snyder’s-Lance, Bacardi and Patron and others. The brick-and-mortar retail clients of these issuers, under pressure from online competitors, have resisted price increases just as issuers’ costs for labor, raw materials and transportation continue to rise.
The quality of the new BBBs
Reasonable observers continue to differ about whether the new ‘BBB’ issuers represent materially different risk than their ‘BBB’ predecessors. The median leverage in ‘BBB’ issuers–net debt to EBITDA–has moved from 1.9x in 2008 to 2.3x today. But credit risk usually comes not from medians but from extremes. Some ‘BBB’ acquirers in debt-funded M&A have shown pro forma leverage of nearly 5x immediately after the acquisition. Keurig Dr. Pepper is close to 5.5x, for instance, and Campbell Soup and Conagra close to 5.0x. Rating agencies traditionally have expected issuers to bring leverage back down to pre-acquisition levels within 18 to 24 months. But in a number of recent transactions—including Keurig Dr. Pepper, Campbell Soup and Conagra—rating agencies have extended the window for deleveraging to 36 months or more. The extended window increases exposure to shifts in the economy, changes in management or new acquisitions that might releverage the company and threaten ratings. The share of ‘BBB-‘ issuers on negative watch, potential fallen angels, has tipped up this year (Exhibit 3).
Exhibit 3: Potential ‘fallen angels’: ‘BBB-‘ issuers outlook or CreditWatch negative
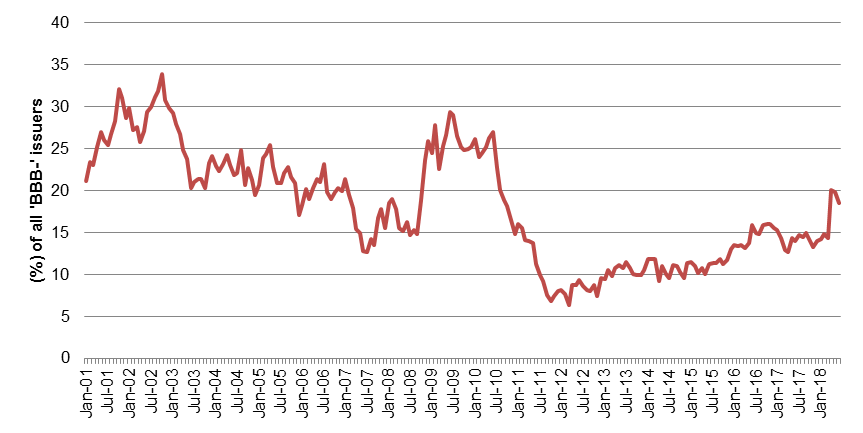
Chart shows the number of U.S. corporate potential fallen angels and the percentage of ‘BBB-‘ issuers that are considered to be potential fallen angels as of the end of each month. Source: S&P Global Fixed Income Research.
Nevertheless, other analysts argue that most ‘BBB’ issuers have tools available to cushion the impact of higher leverage or slight weakening in earnings. Many of the most leveraged issuers have strong, reliable cash flow that management can use to pay down debt. They also can reduce dividends to shareholders and slow equity buybacks if the economy softens.
Leverage to the economy
Even if the quality of current and past ‘BBB’ credit is consistent, the exposure to a softening economy is clear: both the probability and severity of downgrade go up. Trailing 4- and 12-quarter downgrades from ‘BBB’ bumped up after recessions in the early 1990s and early and late 2000s, especially after the Internet bubble burst in 2001 (Exhibit 4A). With each bump higher, the incidence of multi-notch downgrades rose, too (Exhibit 4B). The risk clearly depends on the magnitude and persistence of any slowdown, the strength of recovery and the monetary and fiscal policies rolled out at the time.
Exhibit 4A: ‘BBB’ downgrades rise into and after economic slowdown
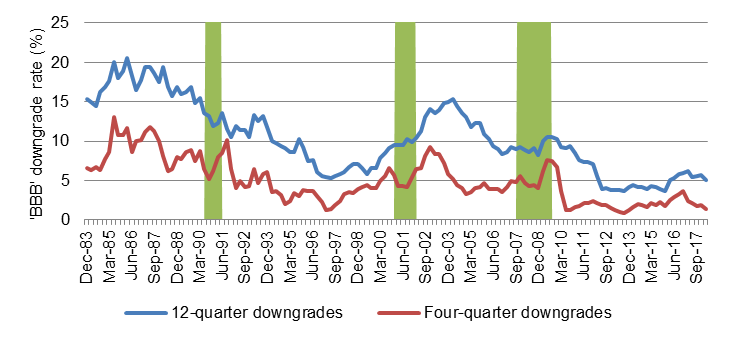
Shaded areas are periods of recession as defined by the National Bureau of Economic Research. Sources: S&P Global Fixed Income Research and S&P Global Market Intelligence’s CreditPro®.
Exhibit 4B: The incidence of multi-notch downgrade from ‘BBB’ increases, too
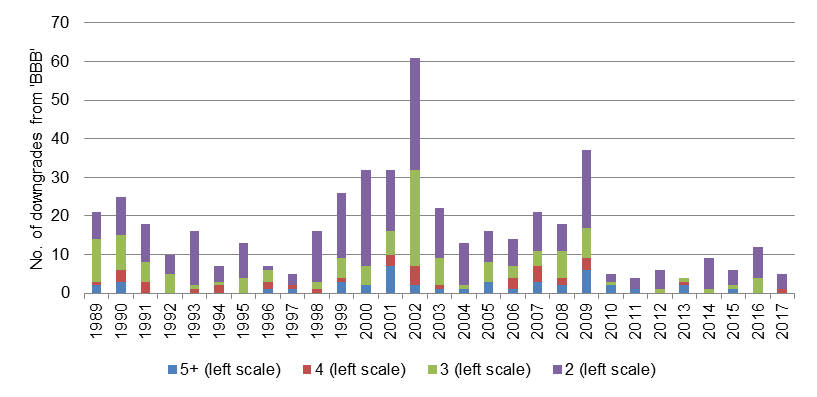
*At the beginning of each year. Sources: S&P Global Fixed Income Research and S&P Global Market Intelligence’s CreditPro®.
Impact on securities value
The obvious concern about ‘BBB’ exposure—the thing that makes it different from every other rating category—is the impact of crossing the line from investment to speculative grade risk. For a variety of reasons—forced selling by portfolios limited to investment grade, a sharp jump in required capital for regulated investors, a loss of issuer access to A-2/P-2 commercial paper funding—spreads in ‘BB’ debt are much wider (Exhibit 5). The average yield spread between 10-year ‘BB’ and ‘BBB’ at the end of June stood at 124 bp. Under modest economic or market stress, it can go wider. It widened during credit concerns in early 2016 to 250 bp and during the US debt-ceiling showdown in mid-2011 to 300 bp. At the peak of the 2008 financial crisis, it approached 450 bp.
Exhibit 5: The yield spread between 10-year ‘BB’ and ‘BBB’ has varied widely
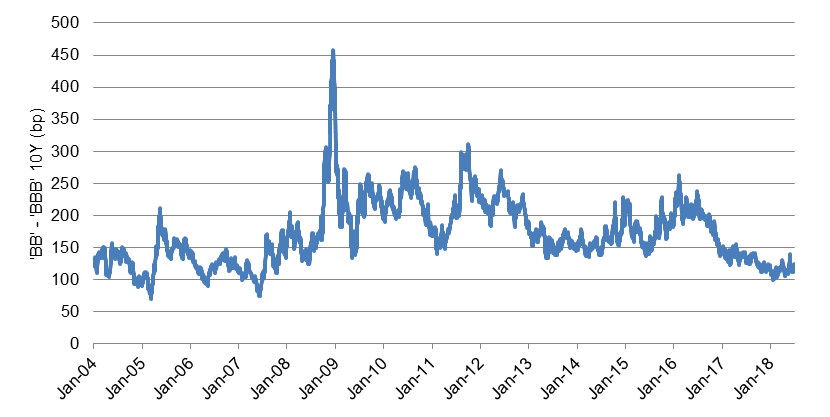
Chart shows the ‘BB’ bond spread minus the ‘BBB’ bond spread, where each is based on corporate bonds with a 10-year maturity, calculated as a composite. Source: S&P Global Fixed Income Research.
The price risk is clear. Since the start of 2004, the average spread between ‘BB’ and ‘BBB’ has been 173 bp. If the average ‘BBB’ spread duration is around eight years, a downgrade to ‘BB’ would drop the price by nearly $14. If 10% of ‘BBB’ names actually dropped this far—a fair assumption in a significant slowdown—the average ‘BBB’ portfolio would take a mark-to-market loss of $1.40. A repeat of 2016 spreads would drop the average ‘BBB’ loss to $2.00, and a repeat of 2011 to $2.40. A 2008 redux would leave a $3.60 average loss. And this is a lower bound since it assumes widening only on names actually downgraded. A much broader set of names would likely widen out of concern about potential downgrade.
Impact on other securities
A slowing economy and wider spreads on ‘BBB’ corporate debt would almost certainly widen and steepen credit curves across fixed income. A potential flow of fallen angels would threaten to push a wave of supply out of investment grade debt and into the high yield market. Capital limited to investment grade would have to chase fewer assets across both corporate and structured credit markets, and capital focused on high yield would have a surplus of supply. The credit curve would likely steepen sharply, with lower credits across corporate and structured markets widening sharply and higher credits lagging the move. ABS or MBS credit or others backed by the consumer balance sheet might do the best since the consumer is in strong shape today, although the consumer would likely weaken a bit as the economy slows and unemployment likely rises. Some capital would likely spill into agency MBS or even Treasury debt. Spreads on commercial paper would likely widen, too.
Impact on holders
Life insurers, mutual funds and individuals are the largest holders of corporate debt. For life insurers, the National Association of Insurance Commissioners risk-based capital charge jumps from 1.3% at ‘BBB’ to 4.6% at ‘BB’. Some insurers might find themselves stretched on capital, turning them into motivated sellers of issues likely to get downgraded or already downgraded. They also could become sellers of their most liquid positions to raise cash. Mutual funds would likely sell downgraded credits to get back within investment guidelines and more liquid assets to address possible redemptions. High yield funds or hedge funds could become ready buyers. Individuals would likely hold.
Echoes from the 2000s
Low rates and a bid for yield produced lending that left consumer balance sheets vulnerable in the late 2000s, and now similar influences are driving risk on corporate balance sheets. This is not to say that the corporate balance sheet is in remotely the same condition as the 2008 consumer. But there are echoes. Investors will have to watch the build in ‘BBB’ and weigh the increasing absolute exposure to economic growth. The risk in corporate debt is creeping up.
***
The view in rates
Relentless range trading has been the theme for months in rates, with the curve re-flattening this week as 10s gravitated back towards the lows. There is nothing meaningful data-wise the final week of August, trading volume is likely to be stagnant, and the Fed is operating a steady pace car for the front end. Which is a near perfect set-up for something genuinely dramatic to occur. China is re-managing its currency and any last minute pension buying of the long end will occur between now and September 15th. Short term view is for lower rates in the long end with 10s30s the first threat towards inversion.
The view in spreads
The background of a Fed steadily removing liquidity and the risk profile of investment grade credit steadily rising is not promising for spreads. Anecdotal evidence suggests that investors are starting to reallocate away from investment grade credit and into other things. Although agency MBS is likely to do better than credit, the gravitational pull is wider.
The view in credit
Investment grade credit spreads have been mostly drifting sideways, widening a few basis points over the month, but remain considerably tighter than the recent “wides” of late June. Issuance is expected to be very light the final week of August, and as long as the equity market doesn’t fall out of bed, spreads are likely to be sticky until after the holiday. The one wrinkle could be a significant rise in oil or commodity prices, which could pressure spreads wider, but that’s unlikely to materialize next week.