


Uncategorized
MBS: Issuers start to address negative convexity in non-QM
admin | May 24, 2019
This document is intended for institutional investors and is not subject to all of the independence and disclosure standards applicable to debt research reports prepared for retail investors.
Along with the usual prepayment and credit risks in private non-QM securitizations, many also allow the issuer to call the deal and collapse it after a certain amount of time. Investors need compensation for selling the embedded call to the issuer and taking on the negative convexity. With the call, deal classes should not trade much above par and could trade well below if interest rates rise. Issuers have started to address the negative convexity by adding step-up coupons to non-QM deals.
In Invictus’ recent VERUS 2019-2, for example, the structure includes coupons on classes A1 through A3 that step up by 100 bp after three years. This is also the same date when the issuer can call the deal. For the VERSUS shelf, this is a departure since earlier deals did not include a step-up. The S&P presale report on VERUS 2019-2 notes “the step-up feature may motivate the sponsor to exercise its option to clean up the transaction.”
The step-up addresses the deal’s negative convexity by reducing the likelihood the issuer will leave the deal outstanding as rates rise. If market rates on new non-QM securitizations rise by less than 100 bp, the issuer will still have incentive to collapse the deal. This should keep the price of the step-up classes close to par even as rates rise. The call still means the issuer will likely collapse the deal if interest rates fall, however, so callable classes should not trade above par as the call date approaches.
The impact of the step-up on the VERSUS ‘AAA’ execution is clear from a simple comparison. On February 22, VERSUS 2019-1 ‘AAA’ class with no step-up came at a spread of 115 bp over interpolated swaps. On that same day, the non-QM ARRW 2019-1 priced its ‘AAA’ class with no step-up at a spread of 120 over interpolated swaps. In April, VERUS 2019-2 priced its ‘AAA’ class with a step-up at a spread of 85 bp over interpolated swaps. In May, ARRW 2019-2 priced its ‘AAA’ again with no step-up at a spread of interpolated swaps 110 bp. Using ARRW to control for the general level of spreads, the VERSUS step-up improved the ‘AAA’ execution by 20 bp.
A side-by-side comparison of the major structural and collateral attributes of the four transactions shows that the relationship between the two shelves did not change in any meaningful way between the 2019-1 and 2019-2 deals. Or said another way, the major material difference between the 2019-1 and 2019-2 transactions was that the later VERUS deal had a step-up and the ARRW did not. Comparing the two VERUS deals, the 2019-2 deal had a modestly higher WAC and slightly longer WAM than the earlier deal. While average FICO scores, CLTVs and DTIs were almost identical across the two deals. There was also very little drift in collateral attributes between the two ARRW deals. The collateral backing the 2019-1 deal was a year more seasoned at 28 WALA versus 16 WALA on the subsequent transaction. All other major average collateral attributes were virtually identical across the two ARRW deals. The WAL differential between the earlier and later deals widened to some extent. The incremental 20 bp spread differential between the earlier and later deals is the fact that the VERUS 2019-2 ‘AAA’ may potentially be a significantly shorter bond than the ARRW one due to the combined effect of the shorter WAL and step-up feature. This spread disparity was also reflected further down the pro-rata stack as well. The VERUS 2019-2 ‘AA’ and ‘A’ rated bonds priced 10 bp tighter than their comparable ARRW bond. (Exhibit 1)
Exhibit 1: A side-by-side comparison of non-QM ‘AAA’s
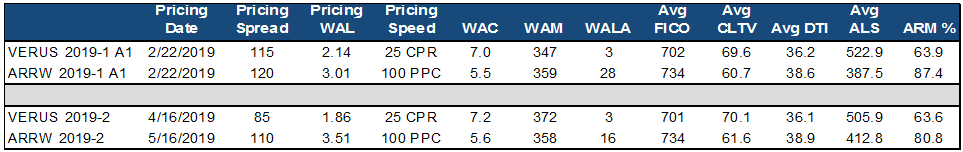
Source: S&PCapital IQ, APS
The step-up coupon improves issuer execution by effectively selling a put to the investor, or, more precisely, a put corridor. Under the simplifying assumption of a perfectly flat yield curve, the investor effectively puts the bond to the issuer for any shift in the curve higher of up to 100 bp. Beyond 100 bp, the bond remains outstanding. The investor owns a put struck at par, and sells a put struck 100 bp higher in yield. The tighter spread on classes with step-up coupons reflects the proceeds from selling the corridor.
The value of non-QM issuer calls and the new implicit investor put is still hard to pin down, so fair value for these options remains elusive. Among other things, prepayment rates vary with interest rates, changing the outstanding balance on the call or put dates. Valuing options on prepayable balances has always been more art than science, but the market is clearly trying its best.