


Uncategorized
A bump along the road to SOFR
admin | September 20, 2019
This document is intended for institutional investors and is not subject to all of the independence and disclosure standards applicable to debt research reports prepared for retail investors.
The market transition from LIBOR to the secured overnight financing rate, or SOFR, hit a bump this week. Repo insiders have known for years that the market does not flow perfectly to cover imbalances in supply and demand for money. The reminders come at the end of every month or quarter, or when Treasury repo surges to 6% on a Tuesday in mid-September. SOFR reset that day at 5.25%, up 282 bp. With SOFR designated to replace LIBOR on a notional $200 trillion of derivatives, loans and securities by the end of 2021, a lot more people will learn about repo, too.
The surge
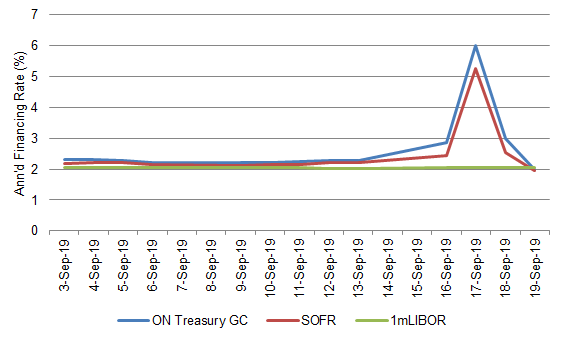
The market has a host of theories about why demand to borrow money overnight suddenly outstripped supply on September 17. Treasury repo and SOFR, which is calculated from Treasury repo rates, both spiked while 1-month LIBOR moved by 2 bp (Exhibit 1). The LIBOR market, looking ahead for 30 days, clearly thought the spike would not last.
Exhibit 1: Repo and SOFR spiked while 1-month LIBOR rolled on
Source: Bloomberg, Amherst Pierpont Securities
Demand for money did not look unusual around September 17. Fed figures on repo borrowing show demand trending up with net outstanding Treasury debt, with demand now standing around $4 trillion. The most recent data show primary dealers financing Treasury inventories of around $225 billion, up 44% from a year ago and 216% from two years ago, but roughly average for this year. Dealers are financing $23 billion of corporate debt after heavy September issuance, the high mark for the year but ultimately not unusual. A widening basis recently between Treasury cash and futures may have drawn outsized demand to buy and finance Treasury positions, so that is a marginal possibility.
The supply of money shifted around September 17, but largely from scheduled events. Corporations and individuals had quarterly tax payments due September 16. A net $20 billion in new Treasury debt settled on September 17. Markets in Japan were closed for a holiday. Custodial banks anecdotally report large withdrawals on September 17 from accounts that often fund repo, the one unscheduled twist.
A nervous financing market, despite all the theorizing, has drawn in the Fed. The Fed has pushed between $53 billion and $75 billion of overnight cash into the market between September 17 and September 20, and plans to push $75 billion a day of overnight cash into the market daily between September 23 and October 10, along with three $30 billion blocks of 14-day term lending.
While it is hard to know how much private cash has flowed into the repo market to capture higher rates, it is clear the Fed thought it might not be enough. That is notable. Banks hold nearly $1.4 trillion in excess reserves at the Fed earning IOER of 1.80% and, in theory, should jump at the chance to earn more in repo. But excess reserves at banks have value beyond their ability to earn interest. They also help satisfy post-crisis regulatory requirements for holding high-quality liquid assets, and that may have frozen the impulse to simply flow into repo. If true, by solving a bank liquidity problem in one place, the Fed may have contributed to a liquidity problem in another place.
Impact on SOFR and beyond
All of this complicates the transition to SOFR, as a recent note from Shearman & Sterling pointed out. LIBOR itself is flawed by relying on too few transactions to represent a reliable market rate, and SOFR does solve that problem. Even on September 17, Treasury repo volume ran at $1.18 trillion. But unlike a rate like LIBOR that reflects market expectations of borrowing costs, SOFR reflects actual, messy, true borrowing costs. And the SOFR market needs to be ready to handle the truth.
If this week had come after the end of 2021, when regulators are encouraging investors to switch from LIBOR to SOFR, the 282 bp spike on September 17 alone would have added an average of 10 bp to SOFR for each of the ensuing 30 days. SOFR in many current contracts typically resets based on rates over the trailing 30 days. On the estimated $200 billion in contracts, loans and securities outstanding, a rise of 10 bp would amount to $200 million.
SOFR also is highly likely to be heavily influenced by the Fed. Of course, the Fed has long influenced and continues to influence LIBOR by shaping market expectations for fed funds. But SOFR at times will almost certainly have not just the Fed’s fingerprints on it, but its boot marks and initials, too. With LIBOR, the Fed could plausibly argue that it does not control market expectations. With SOFR, it will have direct impact. The market would likely not accept that level of influence in private hands. The Fed will have to make the market comfortable.
Beyond the market, the spread of SOFR to corporations, businesses and a wider circle of investor will almost certainly shine a hot light on the financing markets. Corporations and consumers will care about repo. So will their representatives.
The latest bump should put new pressure on developing forward markets in SOFR, which would likely have discounted Tuesday’s spike as an anomaly and moved smoothly past, as LIBOR did. Volume in the CME’s SOFR futures continues to rise but is still well short of LIBOR volumes.
The winners
Even though investors financing almost any asset with overnight funds lost in the repo surge of September 17, there were winners: any portfolio holding SOFR debt. Around $236 billion of securities now float off of SOFR, almost all with coupons that will reflect the recent SOFR spike when the coupon resets. Even though realized volatility in repo financing may cloud the prospects for SOFR, there is always a silver lining.
* * *
The view in rates
The FOMC clearly believes another cut or two in fed funds should be enough to help growth and eventually tip inflation back towards its 2% target. The market isn’t really buying it. The rates of implied inflation and growth implied by 10-year notes and TIPS both fell in the days after the FOMC meeting. The curve has flattened, too. Fundamentals suggest much better growth, and the Fed still has fed funds, forward guidance and QE left to fight low inflation. Trade has become the favored bogey for explaining the gap between Fed and markets, and trade is an influence difficult to predict. The best position: neutral on rates.
The view in spreads
The market has done a far better job of pricing a Fed inclined to create easy financial conditions, and most credit and MBS spreads have tightened. And financial conditions have eased since early August, according to most benchmarks, with lower rates and recent stock market gains contributing. A cut in September is baked in, with a 70% chance of another cut in December. Low rates should help cash flows on corporate and consumer balance sheets.
The view in credit
The credit markets also have struggled to price risks to growth, but rather than price average growth the way rates markets might, credit has had to price for the tail event—recession. Recession seems unlikely in large part due to the readiness of the Fed, the ECB and other central banks to backstop growth. The Fed’s linking of policy to trade risk is among the more explicit examples. The drop in rates broadly and the likely continuing drop in short rates have helped. Fundamental corporate credit is soft with debt-to-EBITDA elevated and EBITDA-to-interest-expense below average. The weakest credits should feel a slowing economy, but without recession, the averages should remain good.