


Uncategorized
A better measure of market risk for CLO loan portfolios
admin | November 8, 2019
This document is intended for institutional investors and is not subject to all of the independence and disclosure standards applicable to debt research reports prepared for retail investors.
CLO investors spend a lot of time focused on potential risk across loan portfolios even though repayments and active management can change the loan mix. The sensitivity of portfolio returns to movement in the broader loan market can be invaluable for investors trying to understand the market exposure of CLOs. Portfolio market sensitivity, or beta, highlights potential change in loan market value and CLO MVOC during market volatility. It is a better measure OF market risk than collateral attributes.
Beta measures the risk of the portfolio relative to the entire market
All loan portfolios have some amount of market exposure, but each portfolio differs. If a portfolio’s returns follow the market’s returns closely, then the portfolio shares a similar level of risk as the market. In that case, market sensitivity or beta is around 1. If portfolio returns consistently fluctuate more than the market, rising and falling more sharply, then portfolio risk is higher than market’s and beta is greater than 1. If portfolio returns are more stable than the market, then portfolio risk is comparably lower and beta is less than 1.
For CLOs, beta is crucial for anticipating changes in spreads of mezzanine tranches. If the overall market price of leveraged loans declines, the MVOC of mezzanine tranches in a CLO deal will too. Beta foretells how much MVOC will be affected. A beta of greater than 1 means the tranches will decline further in value than the market. Since spreads on these tranches will not only rise but also rise faster as MVOC falls, a higher beta can signal greater market risk. Investors should get compensated for this.
Betas for different segments of loan market match intuition about their relative riskiness
Beta does a good job of capturing the relative risk of different loans. Loans with ‘CCC’ rating are riskier than second liens, and ‘B’ loans are riskier than ‘BB’ loans. If beta truly reflects about market risk, then it should be the largest for CCC and greater for B than for BB. This analysis taps into total-returns data on such segments of the loans market (Exhibit 1) and compares their betas to common knowledge about their risk levels.
‘CCC’ loans have the highest beta of 1.54. Second-lien loans are next in line, with a beta of 1.42. This means that if LSTA index returns move down by 100 bp, then ‘CCC’ loans will fall by 154 bp and second-lien loans will fall by only 142 bp. ‘B’ loans have a beta of 1.19, which is 30% higher than the 0.84 beta of ‘BB’ loans. If the LSTA index drops by 100 bp, then ‘B’ will drop by 119 bp and ‘BB’ will drop by only 84 bp.
The case of middle market loans, with a beta of 0.65, is an interesting possible exception. Some investors may view these loans as riskier than their broadly syndicated cousins. However, middle market loans also tend to show less liquidity and prices that change less frequently. Any asset with infrequent price changes will show a relatively low beta to an index that reprices daily. That may say more about the quality of middle market loan pricing than it does about middle market loan risk.
Exhibit 1: Loan beta generally declines with loan risk

Source: S&P LSTA Loan Index, Amherst Pierpont Securities; Note: Only monthly data on total rates of return of 7 indices above and the overall LSTA market index between January 2004 and October 2019 are included. There are 190 observations for each index. Betas are coefficients found in the linear regressions of each specialized index against the market index. Each beta coefficient has high statistical significance (p-value < 0.0001) in this dataset. The higher the beta, the higher the exposure to the overall leveraged loans market.
Investors can think of portfolio beta as a blend of betas on the underlying loans. Portfolio returns over a given period is the average of returns on the underlying loans weighted by their current balances over the same period. Therefore, sensitivity of the portfolio’s returns to market’s returns is also a weighted average of the sensitivity of individual loans’ returns to market’s returns.
Today’s active CLOs can show dramatically different betas. The 1,373 CLOs tracked by Amherst Pierpont show betas that range from near zero to almost 2.0 with a median of 0.97 (Exhibit 2). Beta measures the market risk and potentially the distinct risk signature of each deal and, to the extent beta is consistent across a manager’s deals, the distinct signature of the manager.
Exhibit 2: The beta of current active CLO loan portfolios varies widely around 0.97
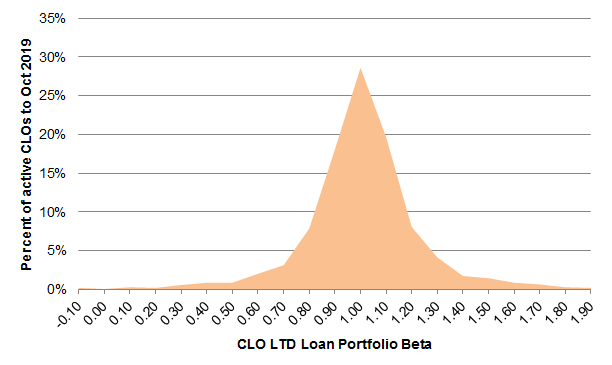
Source: Amherst Pierpont Securities
Comparing uses of collateral attributes and beta
Beta may be a better measure of market risk than the loan attributes many investors use to evaluate CLO loan portfolios. CLOs report every month on a set of collateral attributes including weighted average price, weighted average spread, weighted average rating factor and percentage of second liens, among other things. These attributes offer a valuable snapshot of risks of a CLO deal. However, the correlation between these attributes and beta is surprisingly low (Exhibit 2).
Exhibit 3: Collateral Attributes show low correlations with beta
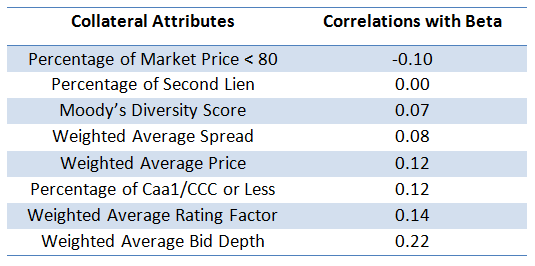
Source: Markit, Amherst Pierpont Securities. Note: Only 1,233 CLO deals observed on September 16, 2019 are included in this analysis. Correlations are between deal life-to-date beta and the indicated loan attributes as of September.
Most attributes have less than 0.15 correlations with beta. The highest correlation is 0.22, between weighted average bid depth and beta. Taking all loan attributes together, they help explain less than 20% of the betas across current active CLOs.
A few things may explain the weak link between beta and loan attributes. Among other things, these attributes are drawn from a snapshot in time, whereas beta is calculated from a history of returns. More broadly, the risk in a CLO loan portfolio relative to the market reflects manager choices about asset allocation, issuer selection, trading strategy and other things that a snapshot may not pick up.
Arguably beta and loan attributes should serve different purposes when describing portfolio risk. Investors should focus on beta to understand the average sensitivity of portfolio returns to broad shifts in the market. Beta can be invaluable for anticipating changes in MVOC and resulting spread volatility. Collateral attributes also reflect potential market risk, but inefficiently. On the other hand, loan attributes can highlight the tail of risk that might be hidden by averages—a barbell in ratings or liquidity or price, for instance. The tail of risk captures exposure to downgrades or other factors apart from market risk. That is probably the best use of loan attributes.
The uses of beta
It may be easier to hold onto existing metrics to monitor risks of a CLO portfolio, but beta might be a better candidate for the Holy Grail of market risk. While collateral attributes reflect on qualities of the underlying loans, they are less useful than beta in measuring their exposure to the market overall.