


Uncategorized
Projecting agency multifamily default scenarios
admin | May 15, 2020
This document is intended for institutional investors and is not subject to all of the independence and disclosure standards applicable to debt research reports prepared for retail investors.
As the lists of agency multifamily loans in forbearance get longer, it’s time to consider possible default and recovery scenarios over the next few years. With the potential severity of unemployment and depth of recession ahead, the baseline looks more severe than even the experience of 2007.
US real GDP was down -8.4% in 4Q of 2008 at the nadir of the housing crisis induced recession. The unemployment rate, a lagging indicator of economic conditions, peaked a year later at a hair under 10% in December of 2009. It took nearly five years for the sluggish recovery to pull the unemployment rate back below 6%, and six years before the Fed first lifted interest rates from 0.25% to 0.50% in December of 2015.
A consensus has yet to emerge for the nadir of US GDP and peak unemployment due to COVID-19, but recent projections from the Congressional Budget Office (CBO) are that real GDP will decline by 12% quarter over quarter in the Q2, after a nearly 5% drop in Q1. That’s equivalent to a 40% decline in US GDP on an annualized basis. The CBO expects the unemployment rate to average close to 14% during the second quarter and peak at 16% in Q3, slightly lagging the economic recovery, which is forecast to occur during the second half of the year.
The depth of the recession, and the speed and extent of the recovery will dictate most of the parameters influencing multifamily default and loss severity / recovery rates. The forbearance programs launched by the GSEs will clearly ameliorate some stress, but it seems likely that default rates for agency multifamily borrowers will peak at least at or above those seen during the previous crisis. Cumulative default and loss profiles over time will be heavily dependent on how long it takes for the economy to recover.
There are two plausible base cases: the first is a short, but high spike in default rates, which resolves as the multifamily sector recovers in under two years; the second is a “lower but longer” scenario where default rates rise more slowly and peak at a lower level, but the period of peak defaults is extended and the total time to recovery is three years (Exhibit 1).
Exhibit 1: Two base case default scenarios
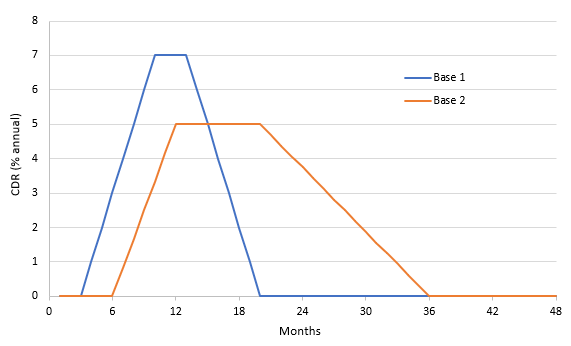
Note: The constant default rate (CDR) is an annualized rate of default that represents the percentage of outstanding principal balances in the pool that are in default. CDR analysis assumes that if a mortgage is in foreclosure the interest and principal payments are being advanced by the mortgage servicing company. Source: Amherst Pierpont Securities
The two base case scenarios produce different cumulative default rates of the underlying collateral over time (Exhibit 2). The first scenario (Base 1) with its sharp spike and quick recovery results in a cumulative default rate of just under 6% of the collateral over time. This is below the peak rate of 7%in the CDR scenario since the peak is brief and the default rate ramps down relatively quickly during the recovery phase. The more prolonged scenario (Base 2) peaks at a 5% CDR, but cumulatively defaults in the underlying collateral reach 8% because the recovery is slower as defaults take longer to ramp down.
Exhibit 2: Comparison of cumulative default rates of base case scenarios
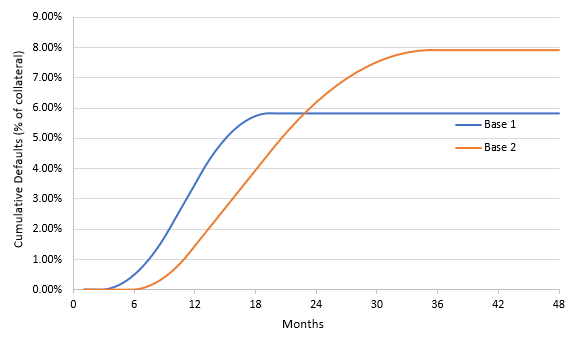
Source: Amherst Pierpont Securities
The graphs of projected cumulative losses in the underlying collateral (Exhibit 3) look nearly identical to graphs of cumulative defaults because a constant loss severity rate is applied. The 8% cumulative default rate in base case scenario 2 results in 2.4% of projected cumulative losses (8% default rate * 30% loss severity = 2.4% losses) over time, so that the cumulative loss curves are 30% lower at every point.
Exhibit 3: Projected cumulative losses (assumes loss severity of 30%)
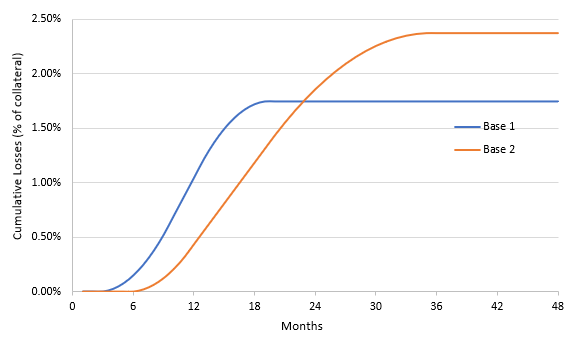
Note: The projected cumulative losses in percent of the underlying collateral is equal to the projected cumulative defaults (%) * loss severity (%). Recovery rate(%) = 1 – loss severity rate (%). Source: Amherst Pierpont Securities
Real life default and loss severity rates vary considerably based on loan characteristics, over time and are subject to many variables not taken into account here. Still, cumulative loss profiles on large baskets of underlying collateral look relatively smooth (Exhibit 4), and different vintages can exhibit a wide variety of profiles based on the underlying default and loss scenarios.
Exhibit 4: Cumulative loss profiles of Fannie Mae multifamily loans by vintage
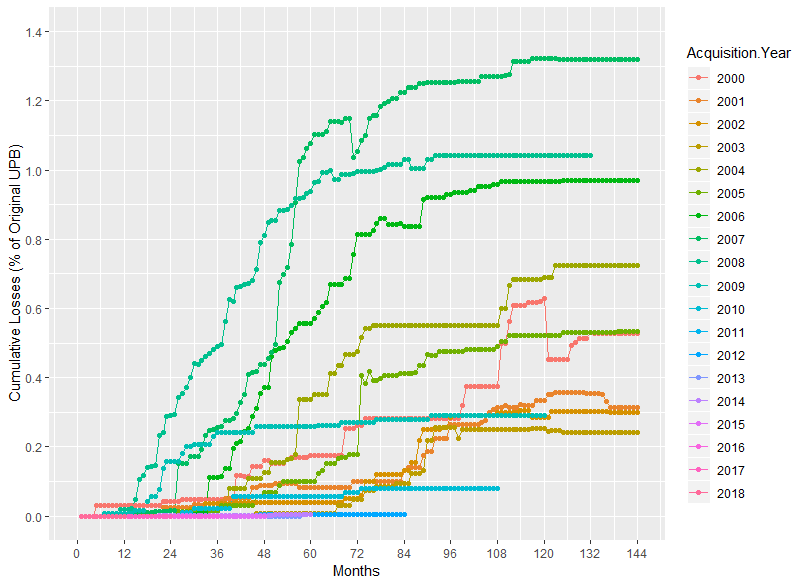
Note: Data as of year-end 2018. Source: Fannie Mae, Amherst Pierpont Securities
Some profiles show characteristics of sharp spikes in default during periods of crisis, particularly the 2007 vintage which so far has the highest cumulative losses of 1.3% and an average loss severity of 29% (Exhibit 5). Others, such as the 2000 and 2001 vintages, are indicative of average default rates but very low loss severities of about 15%. These losses tend to accumulate as the underlying loans approach maturity and fail to refinance and the underlying property is sold for a modest loss.
Exhibit 5: Fannie Mae multifamily loan performance data
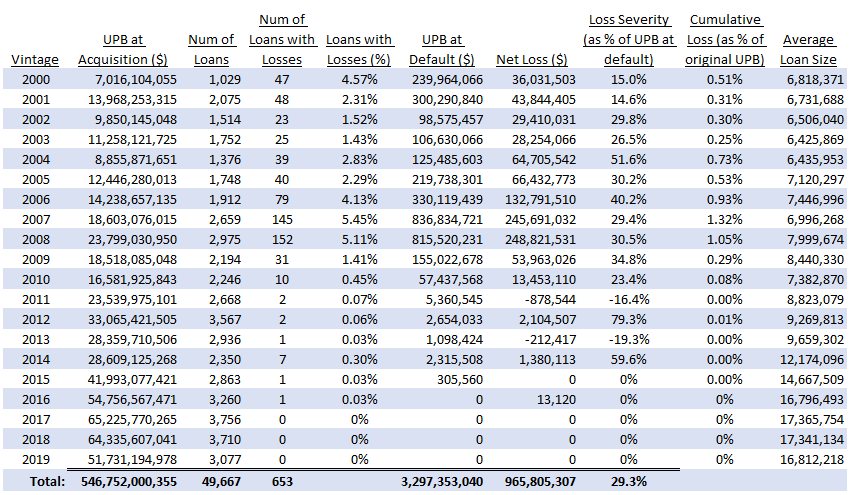
Note: Data as of 3Q 2019. Source: Fannie Mae, Amherst Pierpont Securities
These base case default and loss severity scenarios can be entered into Bloomberg and used in analyze price and yield sensitivity of agency multifamily bonds. Bullish and bearish scenarios can also easily be run by evaluating the default vectors at 0.5x or 2x multiples.