


Uncategorized
Short duration
admin | July 24, 2020
This document is intended for institutional investors and is not subject to all of the independence and disclosure standards applicable to debt research reports prepared for retail investors.
The market for taking interest rate risk these days offers investors a little less than nothing. After accounting for the likely path of fed funds and inflation, the net Treasury yield or term premium goes negative and keeps going further into the red as maturity increases. Two-year Treasury debt looks better than 10-year debt. The Treasury curve has become a rich benchmark and a signal that other forms of risk—credit risk, prepayment risk, liquidity risk—offer better prospective returns.
An inverted term premium curve
The yield compensation along the Treasury curve after accounting for the Fed and expected inflation—the term premium—is not only negative all along the yield curve, it is inverted. The term premium is currently -62 bp for 2-year debt, -82 bp for 5-year debt and -92 bp for 10-year debt (Exhibit 1).
Exhibit 1: Treasury term premiums have gone negative and inverted
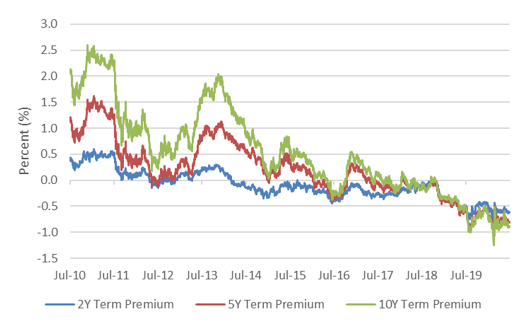
Note: Term premiums reflect estimates based on the Adrian, Crump and Moench model, described here. Source: NY Fed, Bloomberg, Amherst Pierpont Securities
Term premiums have gone negative before and even briefly inverted by a few basis points beginning in mid-2018. But Treasury term premiums inverted sharply last August after the Fed cut rates to counter the impact of US-China tariffs, and the inversion has become steeper. The market seems willing to accept less compensation for risk over a longer horizon that fed funds will yield more or inflation will erode buying power or both.
Reflecting a stronger Fed and stronger net demand at longer maturities
Term premiums have long tracked the riskiness of taking interest rate exposure, so it makes sense that strong Fed guidance has helped push premiums negative in the last decade, especially with actions taken in the last year. Term premiums went negative as far back as the early 1960s when the Fed used Operation Twist to keep rates on the long end of the Treasury curve low (Exhibit 2). Premiums then peaked during the stagflation of the late 1970s and the recession of 1981-1982 and have generally trended down since then with spikes higher after the recession of 1990-1991, the bursting of the Internet bubble in 2001 and the 2008 global financial crisis.
Exhibit 2: Term premiums track the risk of taking rate exposure
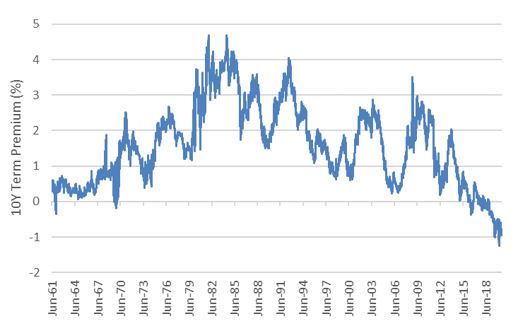
Source: NY Fed, Bloomberg, Amherst Pierpont Securities
Premiums also reflect net demand beyond just expected risk and return. The last decade has seen programmatic buying of Treasury debt by the Fed through QE, by banks required to meet regulatory liquidity rules and by foreign governments that hold large balances of currency reserves. Still, the sharp inversion in the term premium curve in the last year implies that net demand for longer maturities has far outstripped net demand for shorter.
Even with the prospects of the Fed on hold for years, expectations for inflation continue to climb. The risk to fixed income is not so much from rising fed funds but from the accumulating impact of even target levels of 2% inflation eroding portfolio buying power. It seems hard to explain why investors would bypass taking that risk in short maturities to take even more risk in longer maturities.
Trading an inverted term premium curve
In the textbooks, the right answer to an inverted term premium curve is to leverage short-maturity debt to the same dollar duration or rate exposure as long-maturity debt, sell short the longer debt and collect the term premium spread. In other words, get into a yield curve steeping trade. Investors can do that in the Treasury market, but few others.
Portfolios that cannot sell short still may be able to buy short-maturity debt and leverage it to recreate a long effective duration of equity with higher yield. In some markets, floating-rate securities offer enough margin for investors to leverage the coupon for a higher yield without taking on material interest rate risk. The market in CLOs, for instance, trades short ‘AAA’ floating-rate debt with coupons of 3-month LIBOR + 150 bp or wider that lately have traded wide to fair value. In that market, the risk is credit and spread duration. Of course, most portfolios have limits on leverage.
Portfolios that cannot sell short or add leverage should demand a steep spread curve for taking longer credit or prepayment risk. The wider spreads at long maturities have to compensate for the negative term premium in the benchmark riskless curve. For example, the spread curve for private MBS backed by reperforming loans shows the influence of longer weighted average life for each class, the successively lower rating of each class and the increasing uncertainty of prepayment behavior as average life gets longer (Exhibit 3). This spread curve overcomes the inverted term premium.
Exhibit 3: An example of a steep spread curve in private MBS backed by RPLs
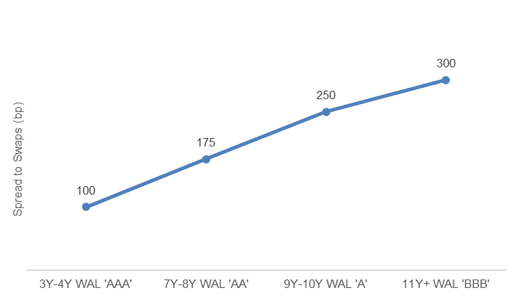
Note: data reflect indicative secondary market spreads for private MBS backed by reperforming loans. Classes pay off sequentially from ‘AAA’ to ‘BBB’ and below, creating a mix of long average lives and increasing credit exposure. Source: Amherst Pierpont Securities
In a fixed income market that offers return for taking a wide range of risks, interest rate risk clearly looks rich. Investment grade corporate or structured credit risk looks like the most attractively priced place to offset negative term premium and the risk that even modest inflation will reduce portfolio value over time.
* * *
The view in rates
Real rates continue to decline, implied inflation continues to rise. The current 0.59% rate on 10-year Treasury debt implies an average real rate of -91 bp and inflation of 150 bp. Real rates, measuring the margin of return over expected inflation, have dropped 7 bp in the last week. Real rates have generally continued to fall and implied inflation has continued to climb since mid-March. That should keep pressure on the yield curve to steepen from 2-year to 10-year and from 5-year to 30-year. After steepening since March, in recent weeks, the curve has flattened.
The view in spreads
The nominal spread of par 30-year MBS to the 5- and 10-year Treasury blend has recently dipped to 98 bp, closing in on its 5-year median of 95 bp. Investment grade corporate spreads continue to tighten toward 131 bp, only slightly wide of its 5-year median of 121 bp. High yield spreads have tightened recently to 549 bp, wide of its 5-year median of 434 bp and with equity volatility still elevated. Nevertheless, the trend is clear. As the Fed continues to absorb high quality assets and spreads tighten, investors will have to move to the next tier of higher risk to get sufficient spread. Spread compression across rating categories or credit quality should continue as long as QE is in place and as long as US deficit spending keep driving up the net supply of Treasury debt. There is fundamental risk in the most leveraged corporate balance sheets, and only there might spreads continue lagging the rest of the market.
The view in credit
The downside in leveraged credit outweighs the upside for now. Beyond the current uptick in Covid-19 in the US, the arrival of the school year in the next two months should create an important test of the ability to safely assemble people indoors. If that proves difficult, then potential productivity and growth should fall. Many investment grade companies have stockpiled enough cash to survive protracted slow growth, but highly leveraged companies and consumers are at risk. Prices on some sectors of leveraged loans, rating agency downgrades in leveraged loans and high yield and rising bank loan loss reserves signal a wave of distressed credit. Rising unemployment and delinquency rates in assets from MBS to auto loans show pressure on the consumer balance sheet. However, monetary and fiscal policies are both shoring up these fundamentals for now. The course of leveraged corporate and consumer credit also depends on renewal of CARES Act unemployment benefits and support for small businesses, along with moratoriums on eviction and foreclosure.