


By the Numbers
To the risk-takers go the rewards
Steven Abrahams and Caroline Chen | March 5, 2021
This document is intended for institutional investors and is not subject to all of the independence and disclosure standards applicable to debt research reports prepared for retail investors.
A steady rally in leveraged loans continues to top the total returns coming from most CLO loan portfolios. But managers with riskier loans and diversified portfolios still tend to edge out their peers, a persistent trend through the market’s rebound over the last year. Only about a third of CLO managers with five or more active deals outperformed the broad loan market from December through February. The average CLO leveraged loan portfolio gained 4.21% but, after adjusting for broad market exposure, or beta, fell behind the market by 0.10%.
Loan returns climbed unswervingly between December and February, carrying on the trend since last April (Exhibit 1). The index continues to rise beyond its pre-coronavirus level. After accounting for the various reporting dates of managers, the S&P/LSTA Index gained 4.21% between December and February. Managers held portfolios with an average beta of 1.04, which meant the average manager should have gained 4.38%. With the actual average performance at 4.28%, the average manager trailed the index by 0.10%.
Exhibit 1: Loan returns exceeded its pre-pandemic peak a year prior by 3%
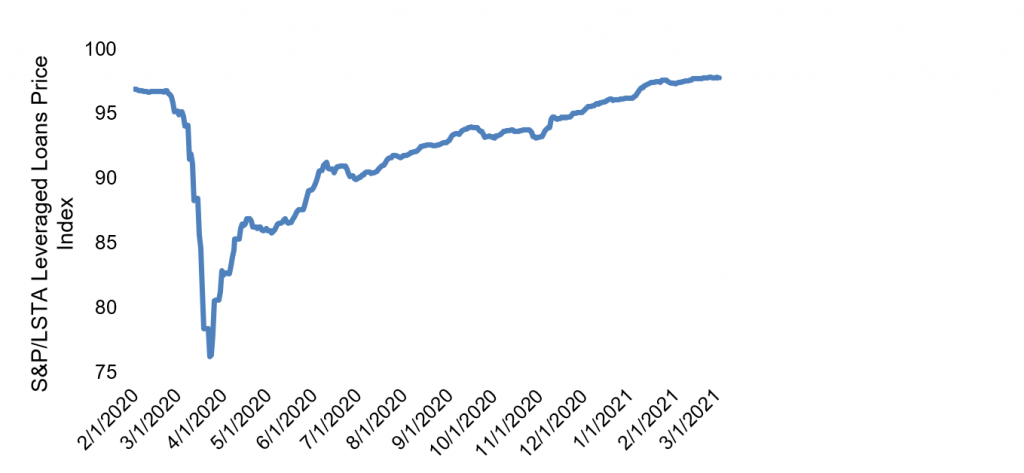
Source: Bloomberg, Amherst Pierpont Securities
About 34% of the managers led the index, a small drop from the figures reported by Amherst Pierpont last month (Exhibit 2). Out of the 72 managers with five or more active deals tracked for December through February, three delivered alpha greater than 50 basis points, while three trailed the index by at least 50 basis points.
Exhibit 2: A third of the managers outperformed the index between December and February
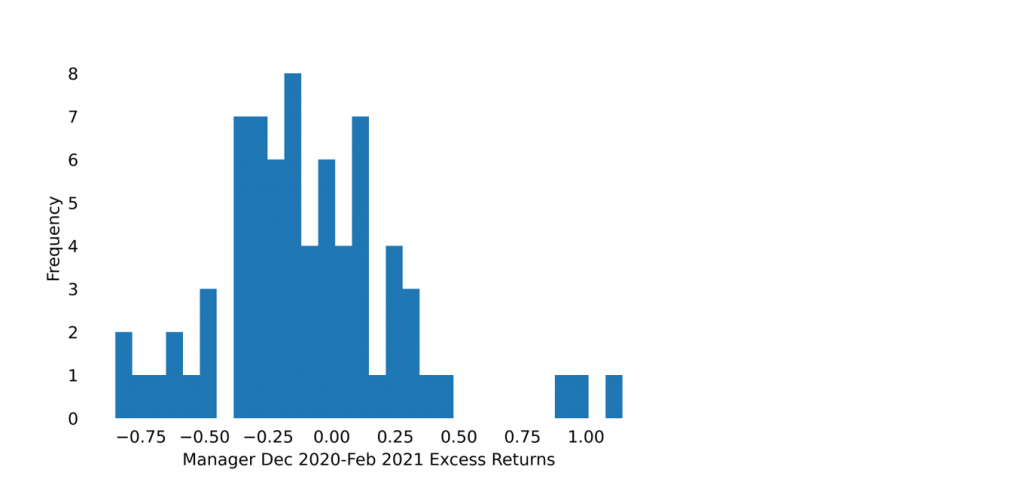
Note: data shows excess return only for active deals.
Source: Amherst Pierpont Securities.
The weighted average rating factor and diversity score of the portfolio correlated most strongly with recent excess returns (Exhibit 3). Managers with riskier loans and better diversified portfolios delivered higher returns. Additionally, wider weighted average spreads correlated with more recent excess returns, although less strongly than weighted average rating factor did. These relationships indicate that managers holding relatively safer loans in a lower rating category while diversifying their portfolios tended to outperform between December and February.
Exhibit 3: Correlation of portfolio or manager features with recent excess return
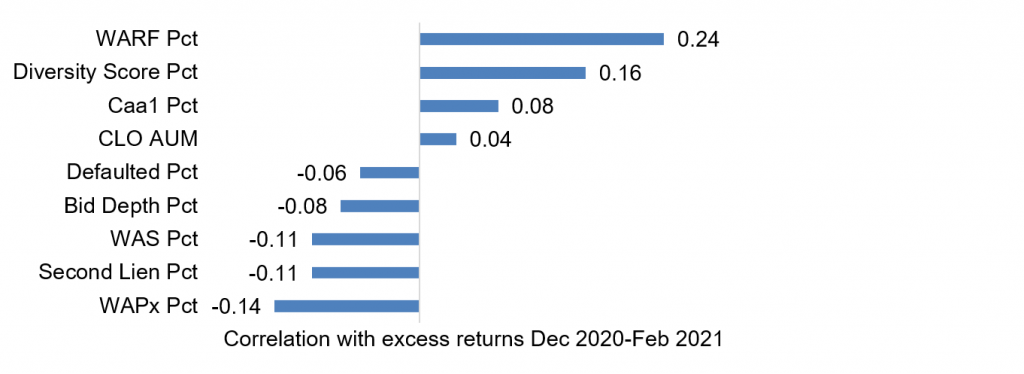
Note: data shows the correlation of manager or loan portfolio attribute with managers’ excess return or alpha from December through February only on active deals. Portfolio attributes measured as percentiles.
Source: Amherst Pierpont Securities.
It is worth noting that syndication of second-lien loans has picked up sharply this year. Second-lien volume has reached the highest level year-to-date since 2015 at $5.8 billion, nearly three quarters of which comes from the syndicated loan market (Exhibit 4). But the spread between first- and second-liens loans has consistently dropped since 2015. It is early, but second-lien exposure so far has not contributed to excess return.
Exhibit 4: YTD second-lien loan volume has jumped, with spreads narrowing
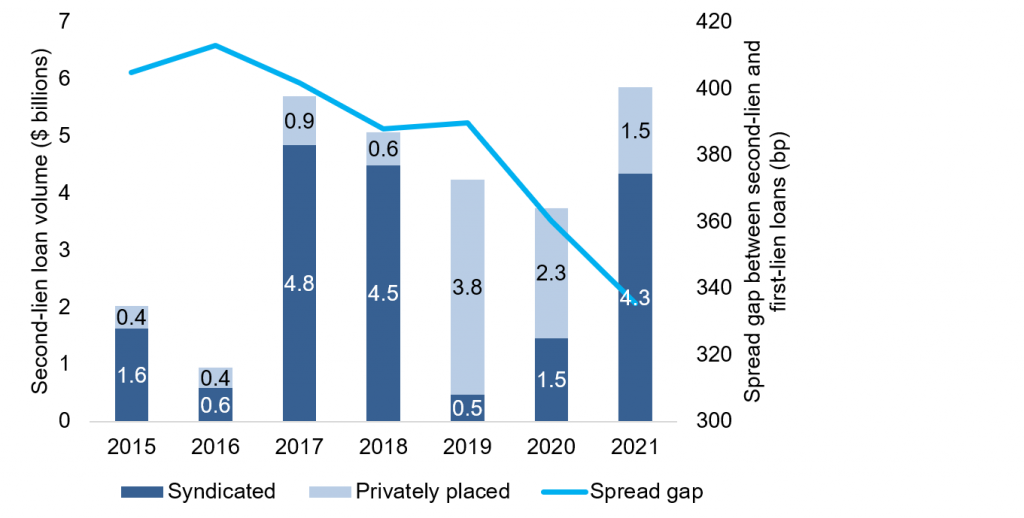
Sources: LCD, APS. Note: Second-lien loan volume includes those loans issued before February 21 in each year. Spread gap represents the difference between second-lien and first-lien spreads for term loans only.
The following managers delivered positive alpha in the market between December and February (Exhibit 5). ZAIS Group and Canaras again top the chart. The other Top 5 include Symphony, MidOcean and Guggenheim.
Exhibit 5: Alpha leaders in CLO portfolio performance December 2020- February 2021
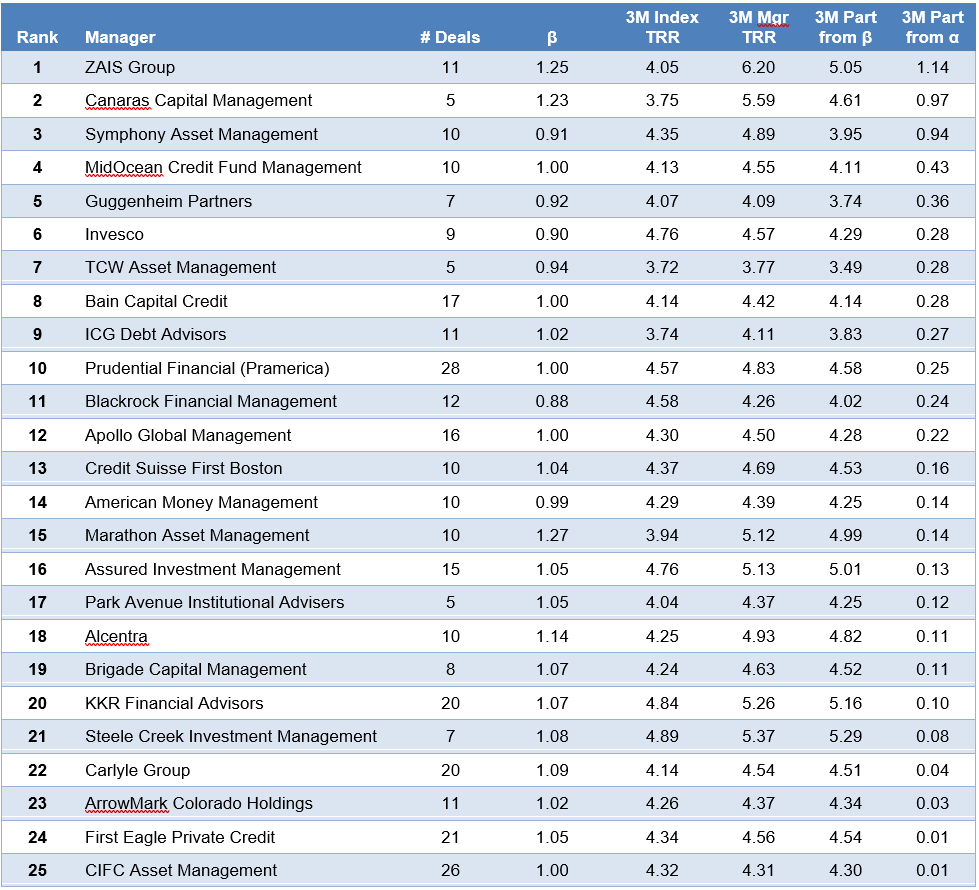
Note: Performance for managers with five or more deals tracked by APS. Performance attribution starts with calculated total return on the leveraged loan portfolio held in each CLO for the 3-month reporting period ending on the indicated date. CLOs, even with a single manager platform, may vary in reporting period. The analysis matches performance in each period to performance over the identical period in the S&P/LSTA Leveraged Loan Index. Where a deal has at least 18 months of performance history since pricing and no apparent errors in cash flow data, the analysis calculates a deal beta. The deal beta is multiplied by the index return to predict deal return attributable to broad market performance. Where no beta can be calculated, the analysis uses the average beta across each manager’s active deals weighted by the average deal principal balance over time. Any difference between performance attributable to beta and actual performance is attributed to manager alpha.
Source: Amherst Pierpont Securities.