By the Numbers
Another month where risk gets rewarded for CLO managers
This document is intended for institutional investors and is not subject to all of the independence and disclosure standards applicable to debt research reports prepared for retail investors.
The average CLO leveraged loan portfolio gained 0.97% for the three months ending in May but, after adjusting for broad market exposure, or beta, fell behind the market by 4 bp. Managers who held riskier loans delivered more excess return in the last three months, continuing a trend that has run for more than a year. Nassau, Symphony, Sculptor, ZAIS and Seix led the pack among managers with five or more active deals.
After accounting for the various reporting dates of managers, the S&P/LSTA Leveraged Loan Total Return Index gained 0.93% between March and May. Managers held portfolios with an average beta of 1.03, which meant the average manager should have gained 1.01%. With the actual average performance at 0.97%, the average manager trailed the index by 0.04%.
About 38% of the managers led the index, a small drop from the figures reported by Amherst Pierpont last month (Exhibit 1). Out of the 68 managers with five or more active deals tracked for March through May, four delivered excess return greater than 30 bp, while eight trailed the index by at least 30 bp.
Exhibit 1: Around 38% of managers outperformed the index between March and May
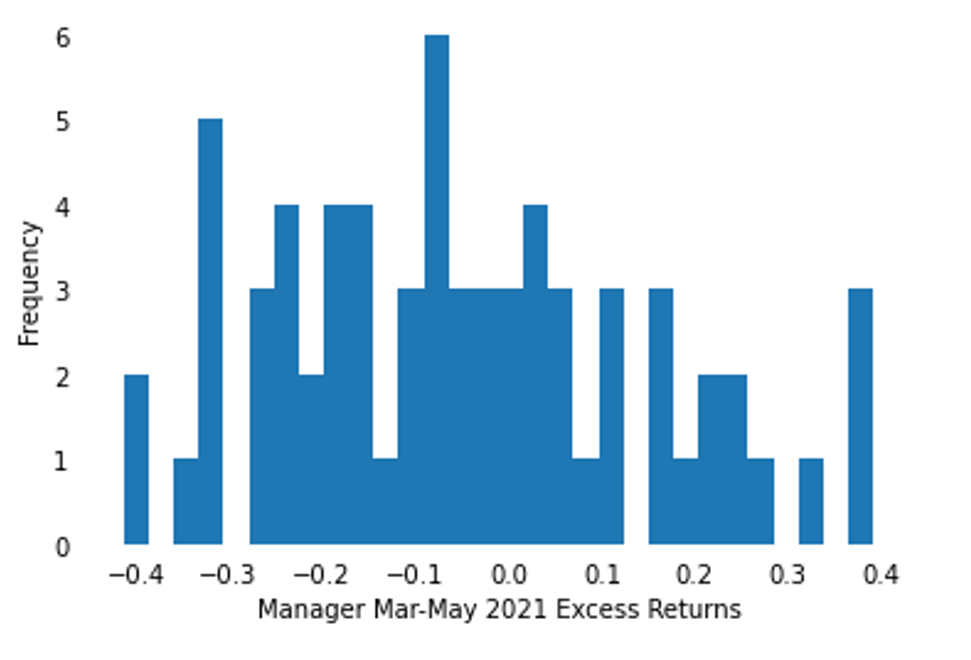
Note: data shows excess return only for active deals.
Source: Amherst Pierpont Securities.
The bid depth and weighted average price of the portfolio correlated most strongly with recent excess returns (Exhibit 2). Managers who held loans that were less liquid or had lower prices delivered higher returns. Additionally, more exposure to the lowest rated loans correlated with more recent excess returns. Diversity or second-lien exposure of the portfolio bore little relation to their recent outperformance.
Exhibit 2: Correlation of portfolio or manager features with recent excess return
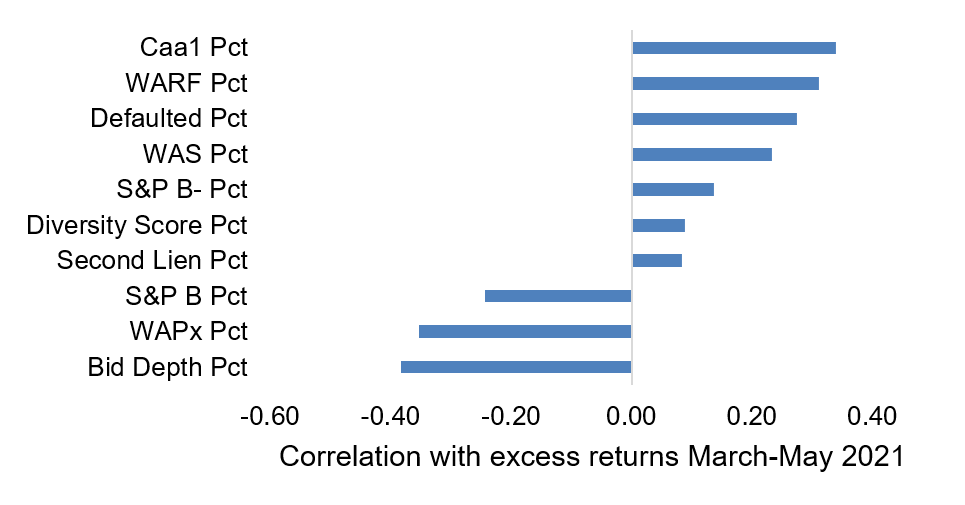
Note: data shows the correlation of manager or loan portfolio attribute with managers’ excess return or alpha from March through May only on active deals. Portfolio attributes measured as percentiles.
Source: Amherst Pierpont Securities.
As the leveraged loan market has rallied, the spread gap between ‘B-’ and ‘B’ loans has plummeted to its tightest level since the beginning of 2015 (Exhibit 3). Consequently, managers who held more ‘B-’ loans benefited more from their price appreciation between March and May.
Exhibit 3: Demand for higher-yielding paper compressed the spread gap between ‘B’ and ‘B-’ loans
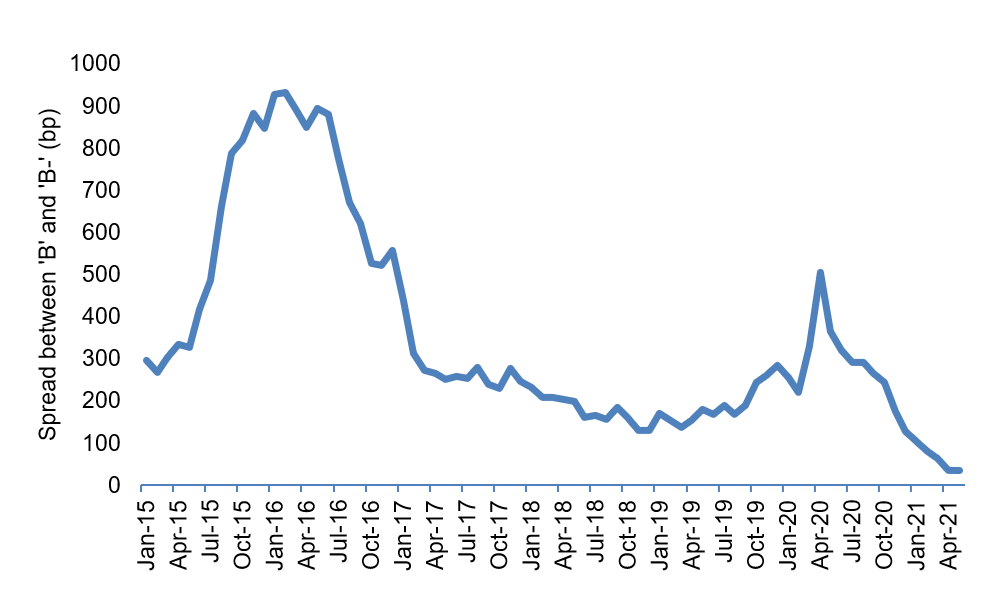
Sources: LCD, Amherst Pierpont Securities.
The following managers delivered excess returns on their loans portfolios between March and May (Exhibit 4). Nassau, Symphony, Sculptor, ZAIS and Seix, make up the Top 5.
Exhibit 4: Alpha leaders in CLO portfolio performance March–May 2021
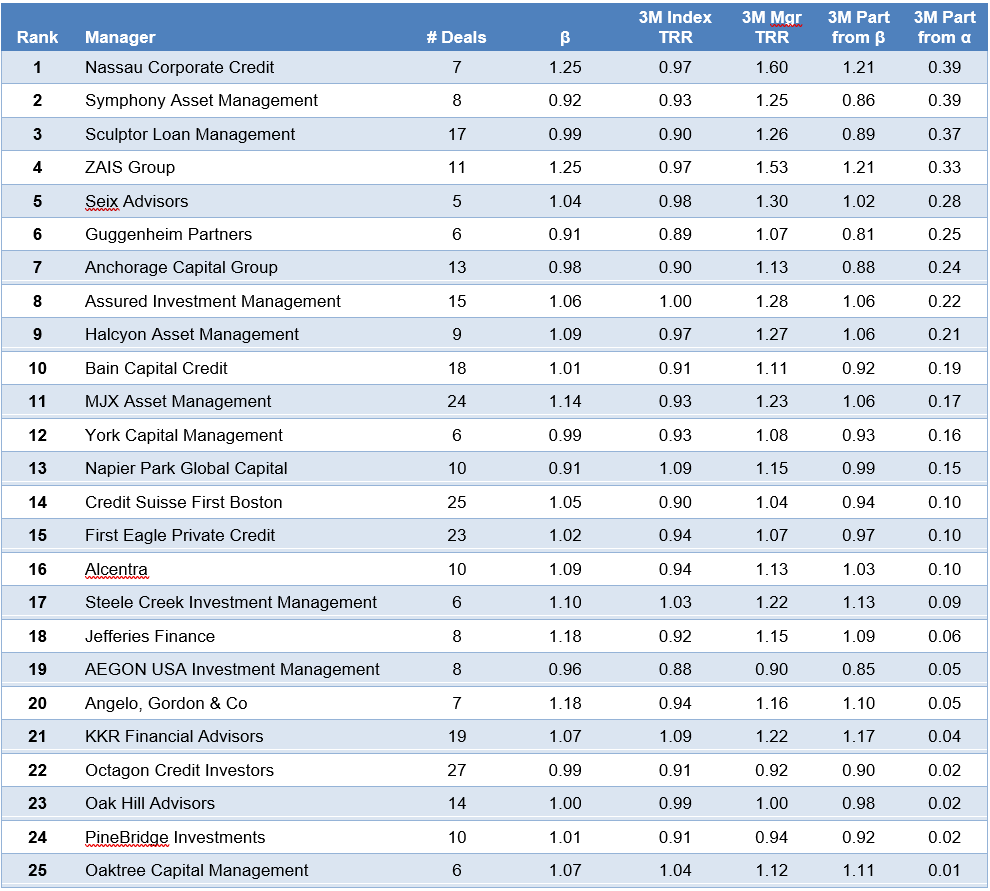
Note: Performance for managers with five or more deals tracked by APS. Performance attribution starts with calculated total return on the leveraged loan portfolio held in each CLO for the 3-month reporting period ending on the indicated date. CLOs, even with a single manager platform, may vary in reporting period. The analysis matches performance in each period to performance over the identical period in the S&P/LSTA Leveraged Loan Index. Where a deal has at least 18 months of performance history since pricing and no apparent errors in cash flow data, the analysis calculates a deal beta. The deal beta is multiplied by the index return to predict deal return attributable to broad market performance. Where no beta can be calculated, the analysis uses the average beta across each manager’s active deals weighted by the average deal principal balance over time. Any difference between performance attributable to beta and actual performance is attributed to manager alpha.
Source: Amherst Pierpont Securities.
This material is intended only for institutional investors and does not carry all of the independence and disclosure standards of retail debt research reports. In the preparation of this material, the author may have consulted or otherwise discussed the matters referenced herein with one or more of SCM’s trading desks, any of which may have accumulated or otherwise taken a position, long or short, in any of the financial instruments discussed in or related to this material. Further, SCM may act as a market maker or principal dealer and may have proprietary interests that differ or conflict with the recipient hereof, in connection with any financial instrument discussed in or related to this material.
This message, including any attachments or links contained herein, is subject to important disclaimers, conditions, and disclosures regarding Electronic Communications, which you can find at https://portfolio-strategy.apsec.com/sancap-disclaimers-and-disclosures.
Important Disclaimers
Copyright © 2024 Santander US Capital Markets LLC and its affiliates (“SCM”). All rights reserved. SCM is a member of FINRA and SIPC. This material is intended for limited distribution to institutions only and is not publicly available. Any unauthorized use or disclosure is prohibited.
In making this material available, SCM (i) is not providing any advice to the recipient, including, without limitation, any advice as to investment, legal, accounting, tax and financial matters, (ii) is not acting as an advisor or fiduciary in respect of the recipient, (iii) is not making any predictions or projections and (iv) intends that any recipient to which SCM has provided this material is an “institutional investor” (as defined under applicable law and regulation, including FINRA Rule 4512 and that this material will not be disseminated, in whole or part, to any third party by the recipient.
The author of this material is an economist, desk strategist or trader. In the preparation of this material, the author may have consulted or otherwise discussed the matters referenced herein with one or more of SCM’s trading desks, any of which may have accumulated or otherwise taken a position, long or short, in any of the financial instruments discussed in or related to this material. Further, SCM or any of its affiliates may act as a market maker or principal dealer and may have proprietary interests that differ or conflict with the recipient hereof, in connection with any financial instrument discussed in or related to this material.
This material (i) has been prepared for information purposes only and does not constitute a solicitation or an offer to buy or sell any securities, related investments or other financial instruments, (ii) is neither research, a “research report” as commonly understood under the securities laws and regulations promulgated thereunder nor the product of a research department, (iii) or parts thereof may have been obtained from various sources, the reliability of which has not been verified and cannot be guaranteed by SCM, (iv) should not be reproduced or disclosed to any other person, without SCM’s prior consent and (v) is not intended for distribution in any jurisdiction in which its distribution would be prohibited.
In connection with this material, SCM (i) makes no representation or warranties as to the appropriateness or reliance for use in any transaction or as to the permissibility or legality of any financial instrument in any jurisdiction, (ii) believes the information in this material to be reliable, has not independently verified such information and makes no representation, express or implied, with regard to the accuracy or completeness of such information, (iii) accepts no responsibility or liability as to any reliance placed, or investment decision made, on the basis of such information by the recipient and (iv) does not undertake, and disclaims any duty to undertake, to update or to revise the information contained in this material.
Unless otherwise stated, the views, opinions, forecasts, valuations, or estimates contained in this material are those solely of the author, as of the date of publication of this material, and are subject to change without notice. The recipient of this material should make an independent evaluation of this information and make such other investigations as the recipient considers necessary (including obtaining independent financial advice), before transacting in any financial market or instrument discussed in or related to this material.


