


By the Numbers
MBS trading volume slumps
Brian Landy, CFA | July 22, 2022
This document is intended for institutional investors and is not subject to all of the independence and disclosure standards applicable to debt research reports prepared for retail investors.
MBS trading volume has slumped this year as higher interest rates cut into mortgage refinancing and home purchases and as the Fed switches from adding to reducing MBS. TBA volumes have dropped to levels last seen at the start of 2016. Dollar roll volumes have also fallen, matching levels of early 2019. Combined TBA and roll volumes now stand at levels that match the end of 2006, when the outstanding balance of agency MBS was 55% smaller, marking a sharp reduction in current trading volume as a share of the outstanding market.
TBA trading has dropped back to 2016 levels
TBA trading volume has fallen throughout the year, extending a decline that started at the beginning of 2021 (Exhibit 1). Volumes now stand at the lowest level in more than four years.
Exhibit 1: TBA trading volume has fallen steadily this year
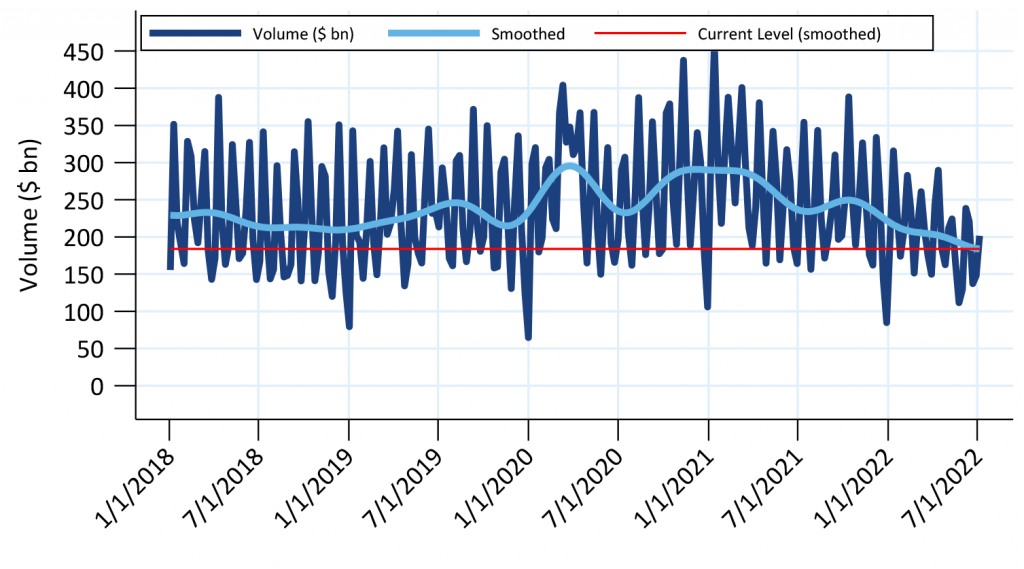
The dark blue line is weekly trading volume, the light blue trend line is extracted using a Christiano-Fitzgerald filter.
Source: Federal Reserve, Amherst Pierpont Securities
Focusing on the volume trend and putting monthly variations aside, TBA trading has not been this low since the start of 2016 (Exhibit 2). TBA trading fell to lower volumes only from mid-2013 through mid-2014.
Exhibit 2: TBA volumes have not been this slow since the start of 2016
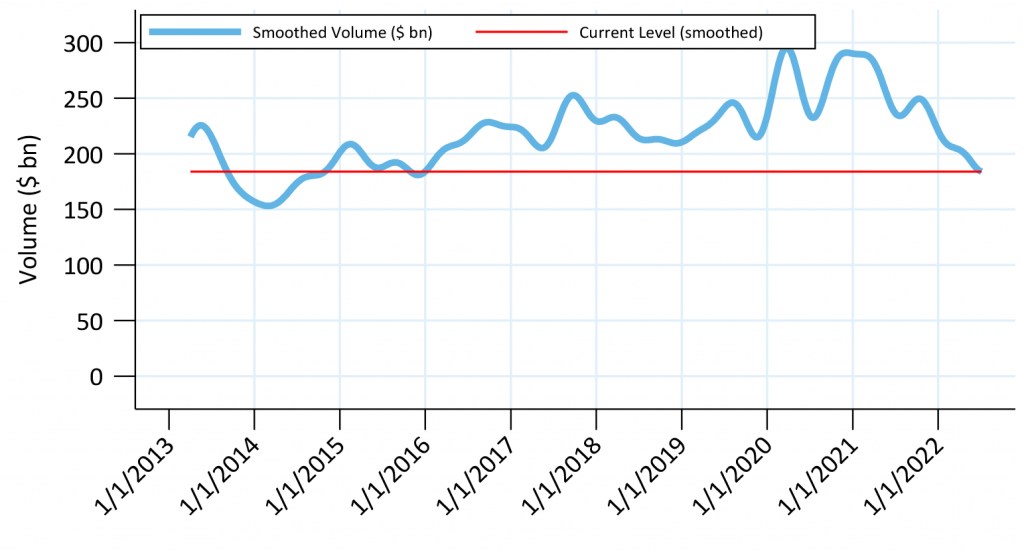
The light blue line is a trend line of weekly trading volume using a Christiano-Fitzgerald filter.
Source: Federal Reserve, Amherst Pierpont Securities
TBA and dollar roll trading are heavily influenced by mortgage origination volumes. Mortgage originators routinely hedge originations with TBA contracts and roll those contracts to manage pipeline interest rate risk. Slowing originations generally lead to lower trading activity.
Mortgage originations have slowed this year. The Freddie Mac 30-year mortgage survey rate started the year at 3.11% and peaked in June at 5.81%, leaving few borrowers with incentives to refinance. Home purchase activity has also fallen, likely because higher mortgage rates and rising home prices have made homes less affordable. Existing homeowners are likely reluctant to give up their current low-rate mortgage to buy a new home. The supply of homes has also been low and may be constraining home sales.
The Fed has lowered its MBS purchases this year, which may also have contributed to less TBA trading. The Fed stopped net growth of its MBS portfolio in mid-March. Until the start of June it reinvested paydowns, but paydowns fell as interest rates increased. And since the beginning of June the Fed has allowed $17.5 billion of paydowns to runoff each month.
Dollar roll usage is at its lowest level since 2018
Dollar roll usage has also fallen this year to a level consistent with the end of 2018 (Exhibit 3). Rolls were special throughout much of the pandemic, which has typically been true when the Fed has been a heavy buyer of MBS. Many money managers and other investors chose to roll TBA instead of investing in specified pools to take advantage of the special carry. Rolls have stayed special this year, but the degree of specialness has generally fallen. There has been more interest in trading specified pools as specialness faded. The exceptions have been high coupons that became the production coupon as mortgage rates increased. Market activity tracked the production coupon higher, but origination in those coupons was slower to increase, and the mismatch caused those rolls to be extremely special.
Exhibit 3. Dollar roll volumes have fallen to levels at the start of 2018
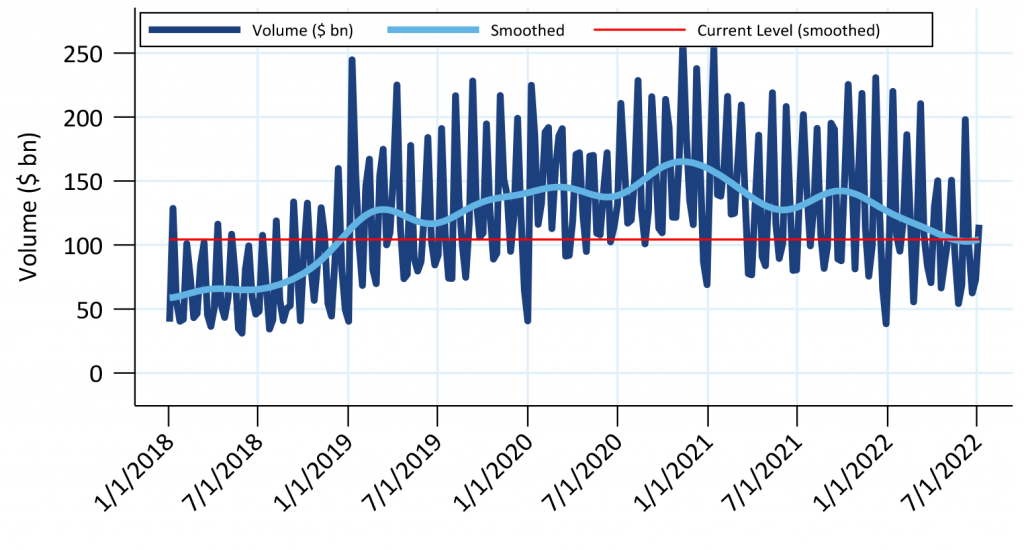
The dark blue line is weekly trading volume, the light blue trend line is extracted using a Christiano-Fitzgerald filter.
Source: Federal Reserve, Amherst Pierpont Securities
It is possible that dollar roll activity could rebound as the Fed’s MBS portfolio gets smaller. The last time the Fed allowed its MBS portfolio to shrink was in 2017 and 2018, which may have contributed to an increase in dollar roll usage in the second half of 2018 and into 2019. Private investors use dollar rolls more often than the Fed, so dollar roll activity is likely to increase as the Fed’s presence in the MBS market shrinks.
Total trading activity is nearing the lowest levels since 2006
Only total trading activity—TBA and dollar rolls combined—can be compared to years before 2013. The Fed began to report separate TBA and dollar roll activity in 2013. Today’s activity is consistent with activity in late 2006, just before the financial crisis (Exhibit 4). Trading volumes were typically higher than current levels from 2007 through 2013, then slowed sharply in mid-2013 and stayed lower than current levels through early 2016. Today’s activity is consistent with activity in 2016 and 2017, but lower than any other time since then.
Exhibit 4. Combined TBA+dollar roll activity is near the lowest level since the 2008 financial crisis
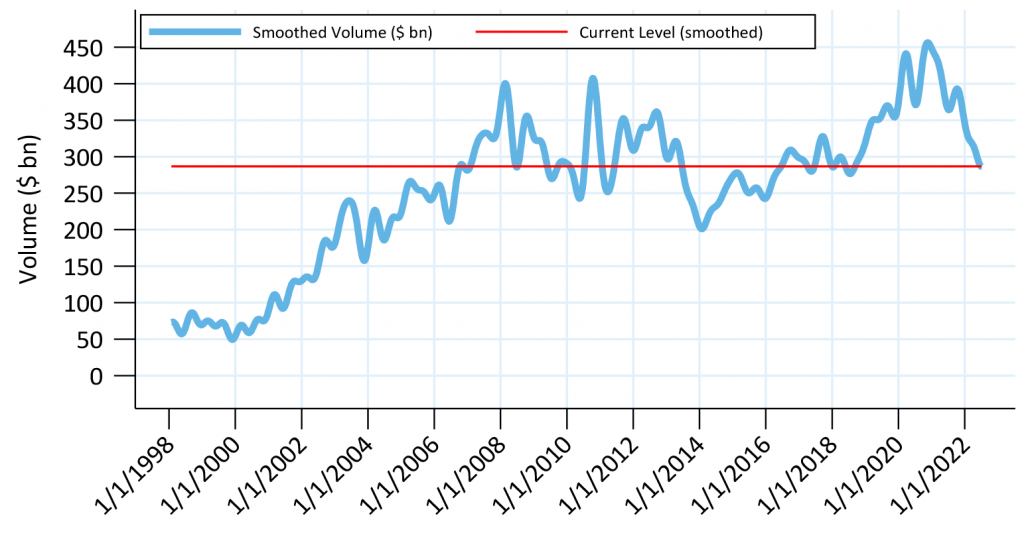
The light blue line is a trend line of weekly trading volume using a Christiano-Fitzgerald filter.
Source: Federal Reserve, Amherst Pierpont Securities